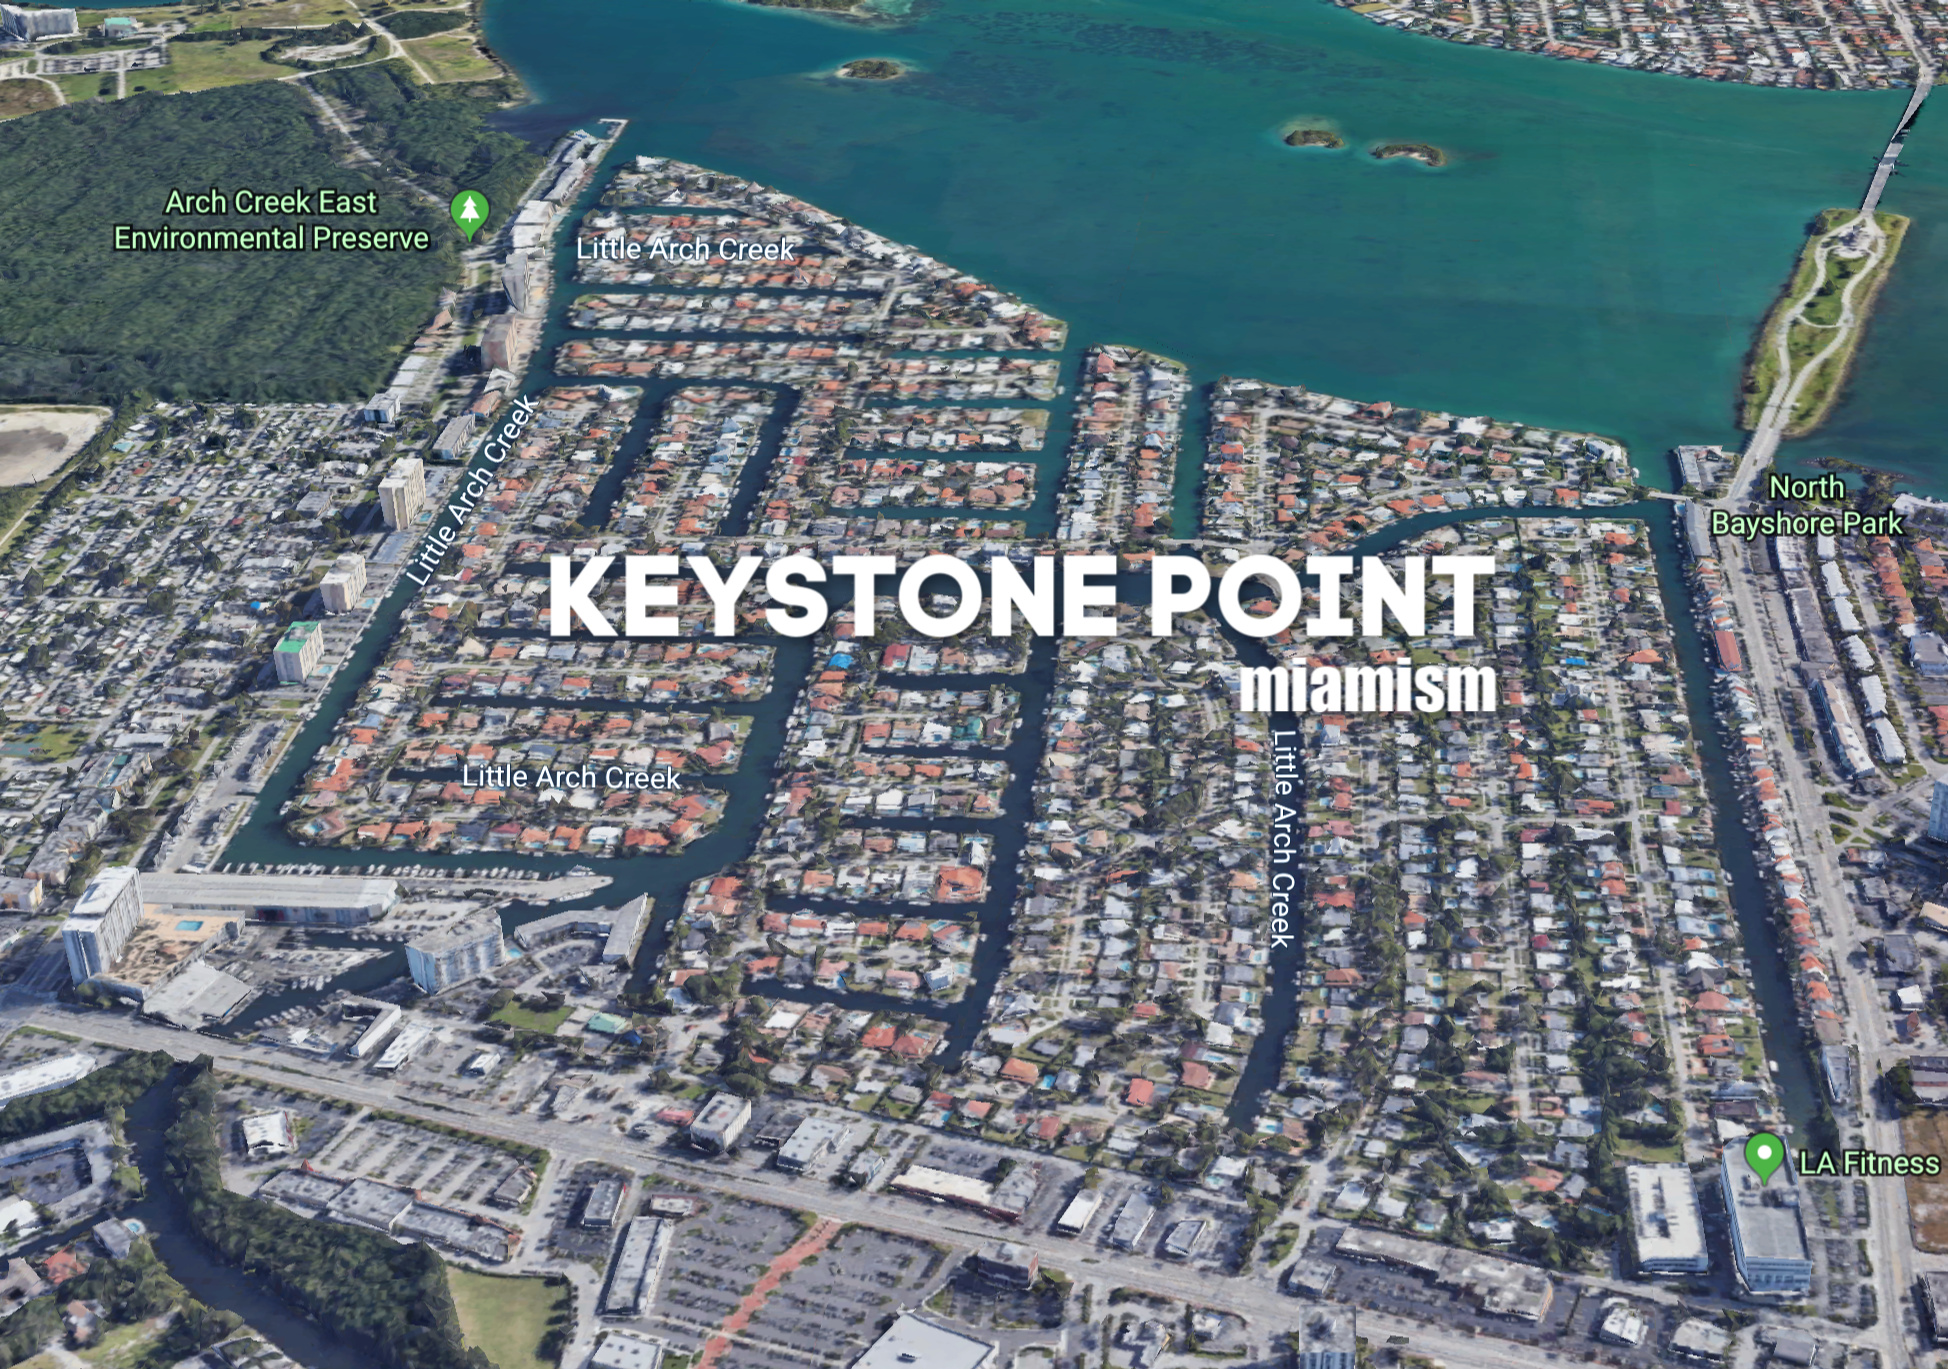
Keystone Point Real Estate Market Report – May 2019
How is the Keystone Point Real Estate Market Doing?
There are currently 45 Keystone Point homes for sale: (compared to 50 in April)
- Highest priced listing: $5,195,000 for the bay-front corner lot at 12600 Biscayne Bay Dr with 265′ of water frontage
- Lowest priced listing: $589,000 for the non-waterfront home at 1905 Alamanda Dr.
- Pending Sales (properties under contract): 9
- Closed sales in May: 3 (compared to 7 in April)
- Median Sales Price in May: $1,000,000
The Keystone Point homes sold in May were the following:
- 2180 Alamanda Dr – non-waterfront home with 4 bedrooms / 3 bathrooms, 2,134 SF on 8,040 SF lot. Originally listed for $985,000 in May of 2018, then again for $899,000 in November os 2018, reduced to $885,000 in January of 2019 and sold for $750,000 ($351/SF)
- 13190 Keystone Ter – waterfront home with 4 bedrooms / 3 bathrooms, 3,114 SF on 9,750 SF lot and 78′ of water frontage. Originally listed for $1,299,000 in September of 2018, then again for $1,187,000 in November of 2018, reduced to $1,099,000 in February of 2019 and sold for $1,000,000 ($321/SF)
- 13095 Keystone Ter – waterfront home with 5 bedrooms / 4 bathrooms, 3,261 SF on 9,750 SF lot and 78′ of water frontage. Originally listed for $1,950,000 in February of 2018, then again in May for $1,895,000, decreased to $1,775,000 in June of 2018, listed again in February 2019 for $1,650,000 and selling at $1,575,000 ($473/SF)
Keystone Point Price per Square Foot
The average sold price per square foot in Keystone Point, for homes on the water, in May was $397. The average price per square foot in the last 2 years has been:
- April’s average $370
- March’s average $434
- February’s average $395 (one sale)
- January’s average $421 (one sale)
- 2018’s average of $476
- 2017’s average of $421
Keystone Point’s Market Action Index increased one point to 27, which is a great sign for the area with an obvious drop in inventory. Once inventory is consumed, we should see upward pressure in pricing.
Slight Buyer’s Advantage
The market has shown some evidence of slowing recently. Both prices and inventory levels are relatively unchanged in recent weeks. Watch the Market Action Index for changes as it can be a leading indicator for price changes.
Keystone Point’s monthly average continues to fluctuate which only serves as a reminder to look at at least 6 months of stats when deciding to buy or sell. The location and condition of the home will be key in determining price and working with a team of REALTORS that really knows the area is a must.
If inventory continues to drop, we should see Keystone move into a seller’s market by the end of the year or beginning of 2020. We will keep a close eye and will continue updating you on findings.
If you want a no-obligation home value report for your property, please visit MiamismVALUE.com and we’ll be happy to send you a personalized report. Or you can simply call me, I do answer my phone (305) 206-9366.
To see our real-time market reports, please visit MiamismTrends.com or Click HERE.