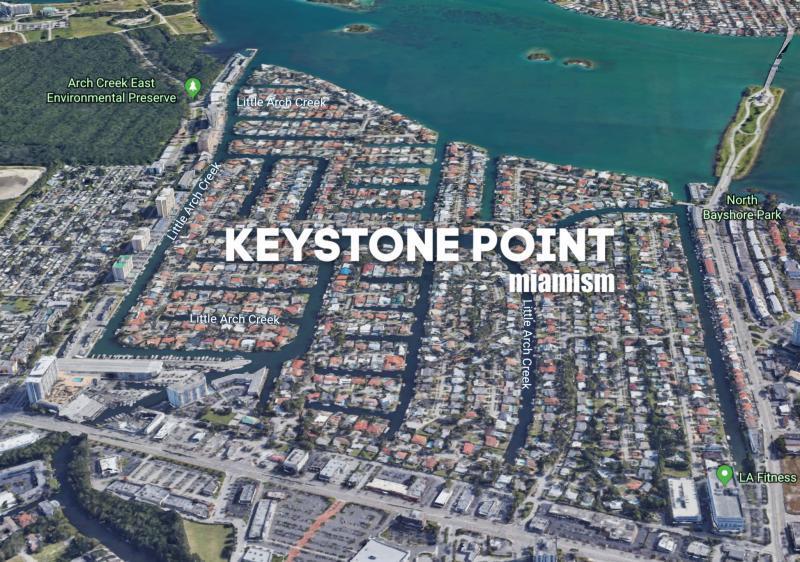
Keystone Point Real Estate Market Report – September 2019
How is the Keystone Point Real Estate Market Doing?
There are currently 43 Keystone Point homes for sale:
- Highest priced listing: $5,195,000 for the bay-front corner lot at 12600 Biscayne Bay Dr with 265′ of water frontage
- Lowest priced listing: $499,000 for the non-waterfront home at 1940 N. Hibiscus Dr
- Pending Sales (properties under contract): 11
- Closed sales in September: 2
- Median Sales Price in September: $1,088,400
The Keystone Point homes sold in September were the following:
- 1950 Alamanda Dr – New Construction from 2016 and non-waterfront with 4 bedrooms / 4 bathrooms, 2,700 SF on 9,375 SF lot. Originally listed for $1,280,000 in September of 2018 and selling for $1,200,000 ($444/SF)
- 12904 Ixora Cir – biggest original lot in Keystone (corner waterfront with over 200′ of water frontage) with 3 bedrooms / 3 bathrooms, 3,771 SF on 15,280 SF lot. Originally listed for $1,590,000 in February 2018 and selling for $976,800 ($259/SF) **cash deal
Keystone Point Price per Square Foot
The average sold price per square foot in Keystone Point, for homes on the water, in September was $259 (one sale). The average price per square foot in the last 2 years has been:
- August’s average $394
- July’s average $479
- June’s average $465
- May’s average $397
- April’s average $370
- March’s average $434
- February’s average $395 (one sale)
- January’s average $421 (one sale)
- 2018’s average of $476
- 2017’s average of $421
Keystone Point’s Market Action Index increased to 27, which shows:
Slight Buyer’s Advantage
Home sales have been exceeding new inventory for several weeks. Since this is a Buyer’s market, prices are not yet moving higher as excess inventory is consumed. However, as the supply and demand trends continue, the market moves into the Seller’s zone, and we are likely to see upward pressure on pricing.
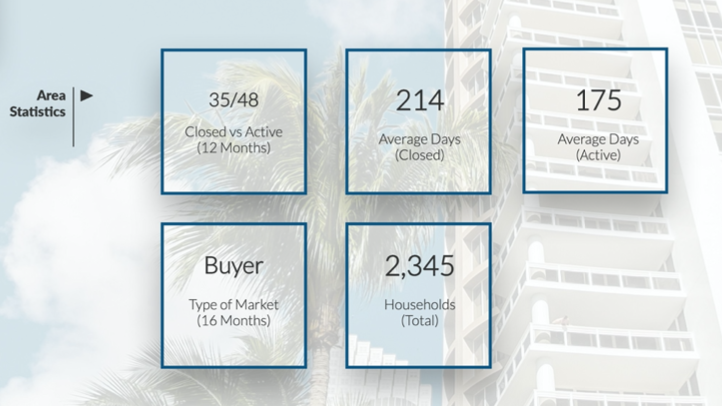
Keystone Point has 16 months of inventory right now. This means that at the current rate of sales, it would take 16 months to sell all the homes that are currently on the market.
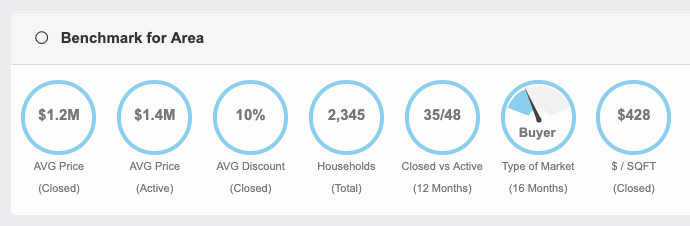
The average price per square foot in the last 12 months is $428 but the average price of listed home is $485 – this shows a big discrepancy between listing and sales price. Cash transactions account to 37.1% of all closed deals, although 82.9% of households are owner occupied.
Take a look at our new reports with averages, absorption rates, per bedroom analysis and robust stats by CLICKING HERE.
If you want a no-obligation home value report for your property, please visit MiamismVALUE.com and we’ll be happy to send you a personalized report. Or you can simply call me, I do answer my phone (305) 206-9366.
To see our real-time market reports, please visit MiamismTrends.com or Click HERE