Miami Shores Real Estate Market Report – July 2019
How is the Miami Shores Real Estate Market Doing?
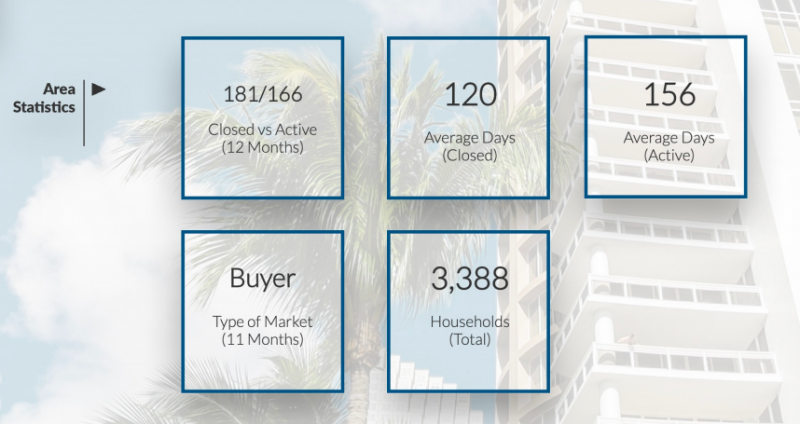
There are currently 107 homes for sale: (compared to 109 last month)
- Highest priced listing is
$5,590,000$5,400,000 for the bay front home located at 9901 NE 13 Ave with 93′ of open bay frontage, 14,024 SF lot and almost 5,000 SF of living space.
- Lowest priced listing is $339,000 for the 2/1 located at 10070 N Miami Ave.
- Pending Sales (Properties under contract): 22
- Median Sales Price in July: $640,00
- Closed sales in July: 19 (compared to 21 in June)
What sold in Miami Shores in July?
The 19 Miami Shores homes sold in July ranged from $3.7 Million to $345,000. The highest sale of $3.7 Million, was for the amazing new home on a dry lot at 9350 NE 12 Ave, selling at $586/SF. The lowest priced sale of $345,000 was for the 3 bedroom / 2 bathroom home at 515 NW 111th St, selling at $253/SF.
Price per square feet ranged this past month from to $609 to $141, all for non-waterfront properties.
What is the average price per square foot in Miami Shores?
The average sold price per square foot in Miami Shores in July for homes not on the water was $328 compared to:
- June’s Average $325
- May’s Average $341
- April’s Average $314
- March’s Average $331
- February’s Average $276
- January’s Average $327
- 2018’s average of $317.
There was 1 waterfront home sold in July, located at 1165 NE 104 St. on the West side of the Biscayne Boulevard bridge (meaning it has a fixed bridge). It sold for $795,000 ($318/SF) <<lower than a lot of non-waterfront homes in the same month.
Miami Shores Opinion
This market may confuse a lot of people, especially when seeing the disparity in price per square foot from $141 to over $600. The reality is that the products are totally different. The homes that are selling above $400/SF are unique, custom homes that merit the price. This is actually something that gives sellers a false sense of pricing because who doesn’t think their own house is unique and will merit that price?
The truth is that you need to work with a real estate professional that knows the area and will be able to identify the audience for the home.
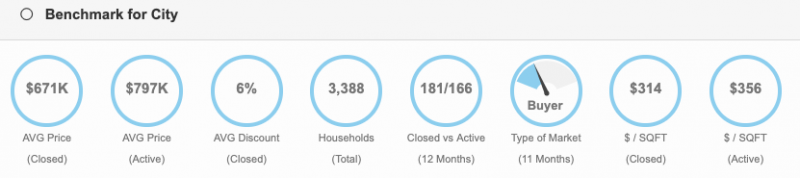
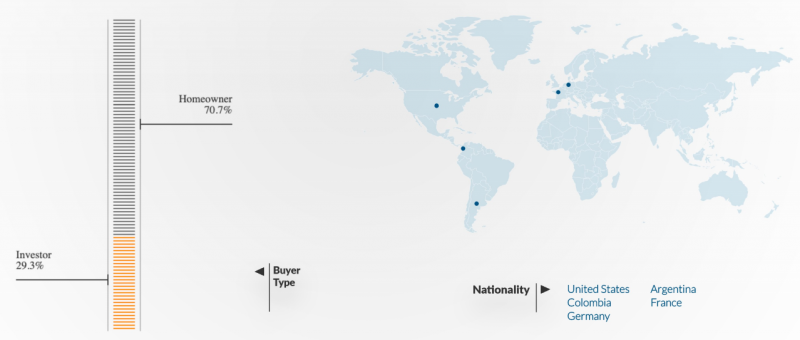
Although most Miami Shores buyers are from the U.S., other countries buying in the area include Argentina, Colombia, France and Germany. Did you know that 36% of all sales in Miami Shores are cash and 71% of buyers are end users (primary residence).
We have been telling you for years that you cannot generalize data and real estate markets are hyper-local. We have the ability to analyze stats now at a micro level, with our new market reports.
Homes that are selling the most in Miami Shores are 3 bedrooms and sell at an average of $313/SF. The second most sold home in 2 bedrooms and that sells at an average of $281/SF. We can analyze sales by size of home, size of lot, bedrooms, year built and so much more.
To get a copy of our comprehensive market report, CLICK HERE or contact us with your address and we’ll be happy to send you a physical copy.
Our real-time market reports indicate that the Market Action Index increased to 30 which still reflects a slight Seller’s Advantage:
The market has shown some evidence of slowing recently. Both prices and inventory levels are relatively unchanged in recent weeks. Watch the Market Action Index for changes as it can be a leading indicator for price changes.
Additional Miami Shores Reports
In addition to these monthly reports that we prepare the first week of each month, we also have our REAL-TIME reports that you can sign up with or request a home value report from MiamismValue.com.
CONTACT us if you are thinking of selling. We would be happy to meet and give you our opinion on your home.