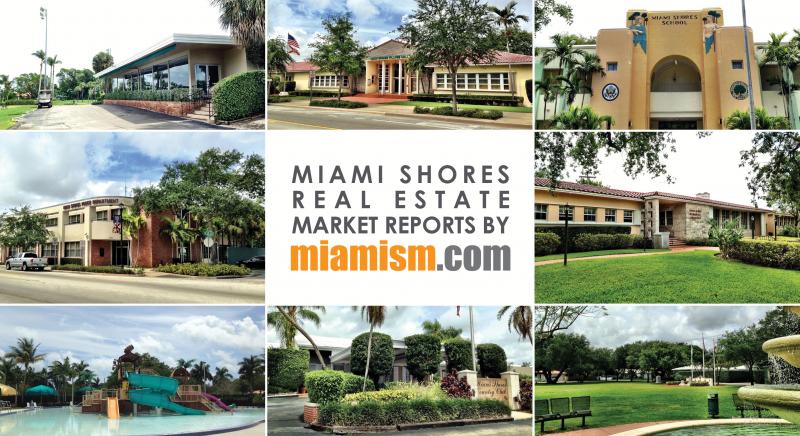
Miami Shores Real Estate Market Report – October 2018
How is the Miami Shores Real Estate Market Doing?
There are currently 115 homes for sale: (compared to 96 in September)
- Highest priced listing is
$5,590,000$5,400,000 for the bay front home located at 9901 NE 13 Ave with 93′ of open bay frontage, 14,024 SF lot and almost 5,000 SF of living space.
- Lowest priced listing is $299,900 for the 3/1 home at 142 NW 111 St identified as “investor special”
- Pending Sales (Properties under contract): 17 (compared to 20 in September)
- Median Sales Price in October: $530,000
- Closed sales in October: 11 (compared to 19 in September)
What sold in Miami Shores in October?
The 11 Miami Shores homes sold in October were the following:
- 202 NW 92 St – 2 bedrooms / 1 bathroom home with 1,154 SF of living space on 9,930 SF lot. Was originally listed for $395,000 in October of 2017 with several price reductions and sold for $340,000 ($295/SF)
- 21 NW 101 St – wood frame home with 2 bedrooms / 2.5 bathrooms, 1,023 SF of living space on 8,000 SF lot. Originally listed for $530,000 in November of 2016 with several price reductions and sold for $420,000 ($411/SF)
- 144 NE 99 St – 2 bedrooms / 2 bathrooms with 1,643 SF on 8,625 SF lot. Listed for $499,000 in August and selling for $445,000 ($271/SF) **cash transaction
- 163 NW 101 St – 2 bedrooms / 2 bathrooms with 1,462 SF on 8,025 SF lot. Listed for $485,000 in July and selling for $447,000 ($306/SF)
- 6 NW 107 St – 2 bedrooms / 1 bathrooms with 1,274 SF on 9,225 SF lot. Listed for $480,000 in July and selling for $462,000 ($429/SF)
- 45 NW 93 St – 3 bedrooms / 2 bathrooms with 1,287 SF on 9,600 SF lot. Purchased for $367,000 in August of 2016, remodeled and relisted for $569,000 in July and selling for $530,000 ($412/SF) **cash transaction
- 137 NE 108 St – 3 bedrooms / 2 bathrooms with 1,943 SF on 9,300 SF lot. Listed for $615,000 on October 1 and selling for $615,000 on October 22 ($317/SF) **cash transaction
- 150 NW 101 St – 3 bedrooms / 2 bathrooms with 1,964 SF on 8,143 SF lot. Listed for $649,900 in March and selling for $620,000 ($316/SF)
- 1430 NE 102 St – 3 bedrooms / 2.5 bathrooms with 2,517 SF on 11,020 SF lot. Originally listed for $995,000 in May, with several price reductions and selling for $930,000 ($369/SF)
- 1291 NE 94 St – 3 bedrooms / 3 bathrooms with 2,795 SF on 9,375 SF lot. Originally listed for $1,150,000 in April and sold for $1,007,500 ($398/SF)
- 1460 NE 101 St – Bay front home with 4 bedrooms / 4.5 bathrooms, 2,877 SF of living space on 12,352 SF lot with 100′ of water frontage. Originally listed in August of 2016 for $3,850,000, with several price reductions and finally selling for $2,781,400 ($967/SF) **cash transaction
What is the average price per square foot in Miami Shores?
The average sold price per square foot in Miami Shores in October for homes not on the water was $352, compared to:
- September $318
- August $324
- July $291
- June $320
- May $312
- April $309
- March $291
- February $283
- January $289
- 2017’s average of $293
There was 1 waterfront home sold in October located at 1460 NE 101 St, directly on the bay. This home was purchased for $2.22 Million in March of 2015, was completely remodeled and placed on the market for sale in August of 2016 for $3.85 Million. It had several price reductions and MLS shows a contract that fell through. It finally sold for $2,781,400 at $967/SF which is market price for bay front homes in Miami Shores.
Miami Shores Opinion
We are seeing an increase in inventory and slight decrease in sales which gives a slight advantage to buyers. The high sales this past month are smaller homes, selling for higher per square foot because there is limited inventory of smaller homes. Condition of the home is key in identifying selling price and there are no unusual high sales except for the wood frame home located 21 NW 101 St which sold for $411/SF.
The waterfront home sold last month, as mentioned above, sold for $967 SF and sat unsold for almost 2 years because it was grossly overpriced from day 1, even if totally remodeled.
The Market Action Index decreased to 29, keep in mind that an index above 30 implies Seller’s Market conditions. Below 30, conditions favor the buyer.
Slight Seller’s Advantage: The market has been consistently cool for several weeks. Demand level are low relative to the available inventory. It’s a Buyer’s market and prices continue to fall. Look for a persistent shift in Market Action before prices plateau or begin to rise again.
Additional Miami Shores Reports
In addition to these monthly reports that we prepare the first week of each month, we also have our REAL-TIME reports that you can sign up with or request a home value report from MiamismValue.com.
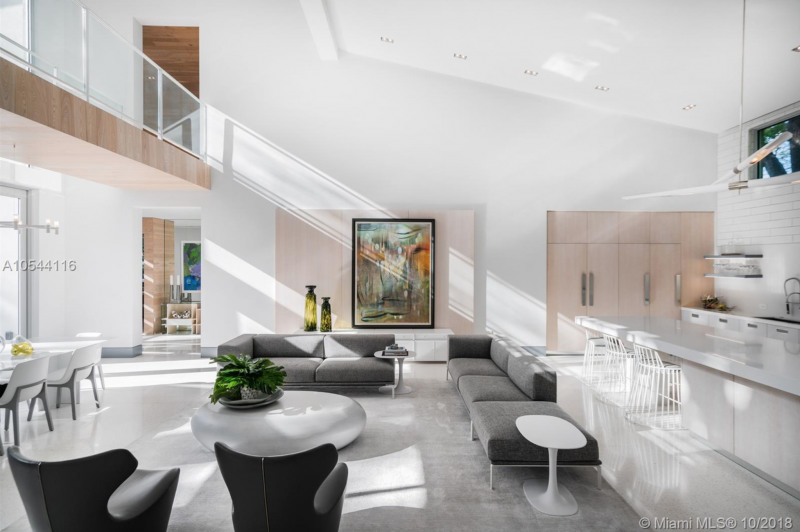
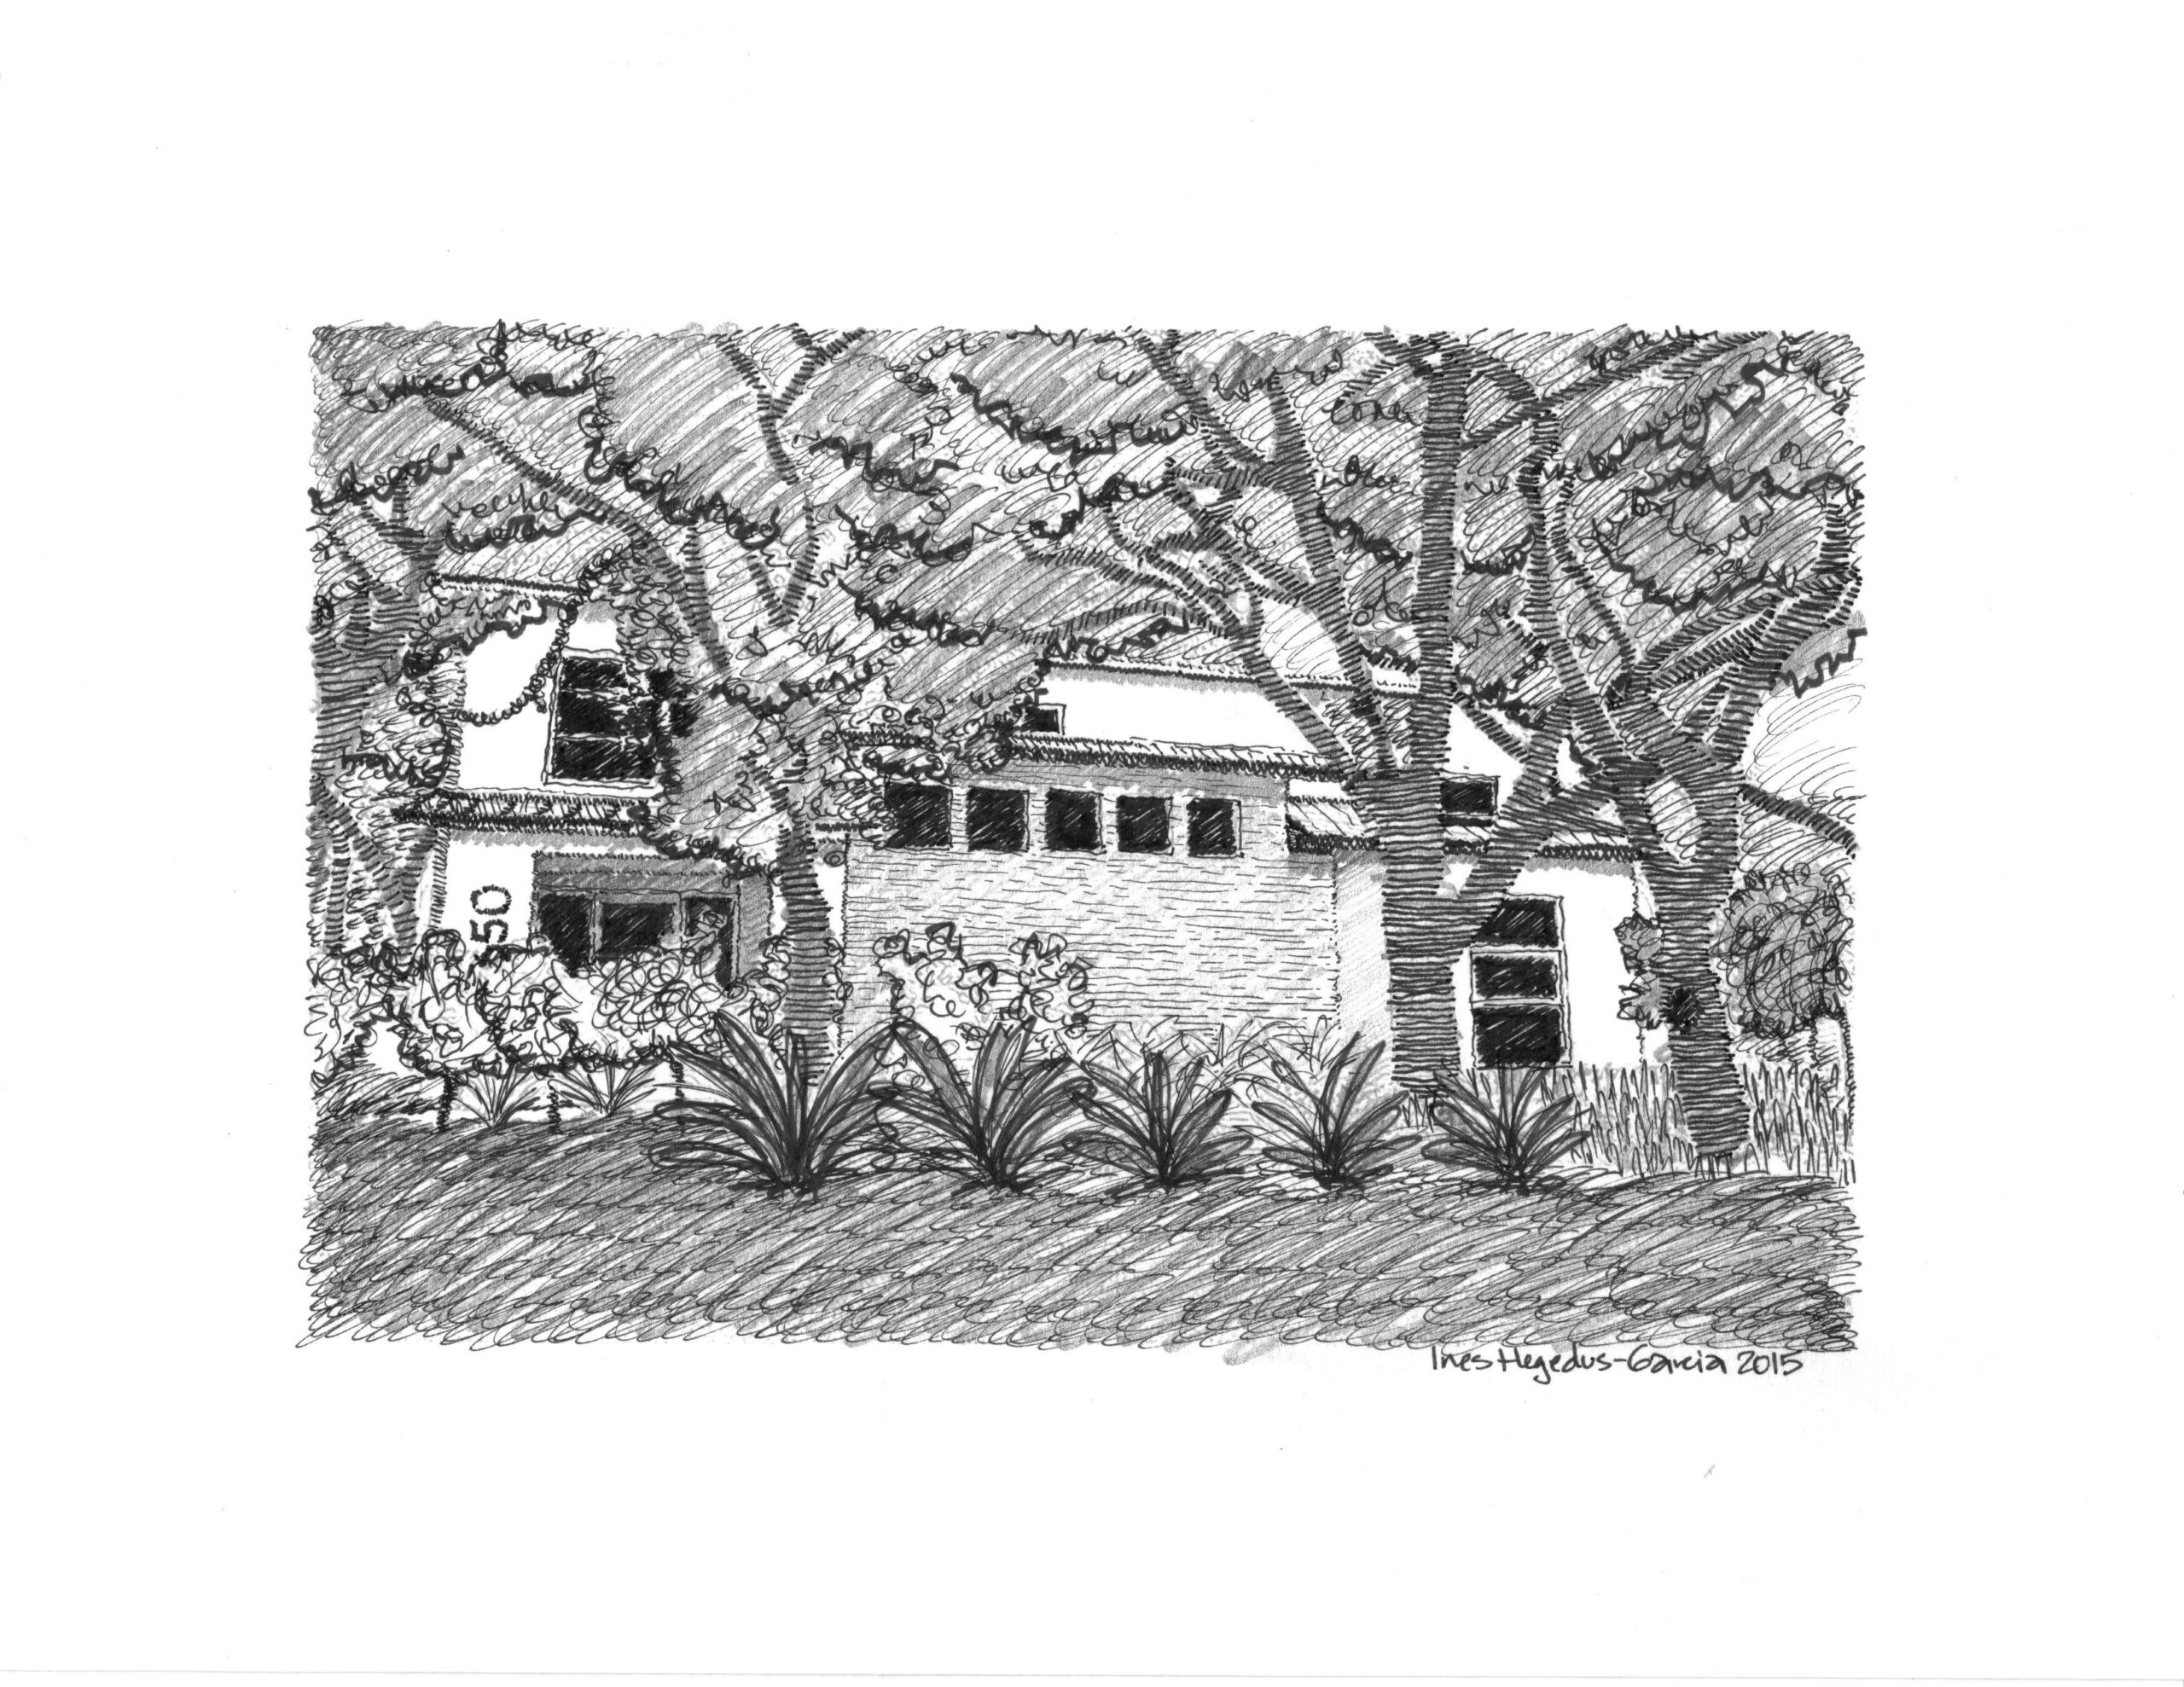
Miami Shores House of The Month
The Miamism Sales Team recommends the one-of-a-kind, custom home located at 9350 NE 12 Ave, designed by Billy Blanco Designs in 2015. We’re talking 6,317 SF of pure awesomeness with all the luxuries and features you could ever want. I did the rendering above in 2015 when the house was first finished and featured in our Heidi Hewes Holiday Walk, a local cancer fundraiser.
The home sits on oversized 19,166 SF lot, East of Biscayne Boulevard and although not on the water, this home will wow you.
Asking Price $3,950,000 ($625/SF)
Please contact us for additional information or to schedule a private showing appointment.