How’s the Miami Shores Real Estate Market Doing? August 2015
Miami Shores Homes – Real Estate Market Report
 There are currently 79 Miami Shores homes for sale (6 more than last month):
- Highest priced listing is $3,975,000 for the bay front fixer upper at 1680 NE 104 St
- Lowest priced listing is $349,900 for the 2 bedroom / 1 bathroom home at 46 NW 96 Street
- Pending Sales (Properties under contract): 35 (same as last month)
- Closed sales in August: 9 (compared to 19 in July)
The 9 Miami Shores homes sold in August were the following:
- 1139 NE 105 St – foreclosure listed for $349,900 in June and selling for $360,000 ($218/sqft) <steal East of the Boulevard!
- 49 NE 108 St – 3 bedrooms / 2 bathrooms; 1,947 SF on 9,225 SF lot. Listed in July for $459,500 and selling for $445,000 ($229/sqft)
- 140 NW 102 St – 3 bedrooms / 2 bathrooms; 1,756 SF on 8,100 SF lot. Listed in May for $449,900 and selling for $450,000 ($256/sqft)
- 190 NW 102 St – 4 bedrooms / 2 bathrooms; 2,692 SF on 8,025 SF lot. Listed in April for $592,000 and selling for $500,000 ($186/sqft)
- 98 NE 103 St – 5 bedrooms / 4 bathrooms; 3,207 SF on 11,910 SF lot. Quite a history on this one having sold for $425,000 in December of 2013 and then listed a year later for $599,000 – several price reductions and finally selling for $515,000 ($161/sq.ft.)<that’s an ouch!
- 1192 NE 91 St – 2 bedrooms / 2 bathrooms; 1,690 SF on 9,375 SF lot. Listed for $589,000 in July and selling for $560,000 ($331/sqft)
- 10659 NE 11 Av – 3 bedrooms / 2 bathrooms; 1,799 SF on 10,400 SF lot. Listed in May for $597,000 and selling for $592,000 ($329/sqft)
- 913 NE 98 St – 4 bedrooms / 3.5 bathrooms; 3,454 SF on 15,300 SF lot. Listed in February for $950,000 and selling for $870,000 ($252/sqft)
- 1051 NE 92 St – 4 bedrooms / 4 bathrooms; 3,867 SF on 23,000 SF lot. Listed in May for $1,299,000 and selling for $1,250,000 ($323/sqft)
There were no waterfront homes sold in Miami Shores in August. The average price per square foot in Miami Shores in August was $254 compared to:
- July $233
- June $240
- May $256
- April $256
- March $247
- February $227
- January $225
2014’s average was $236 (for the whole year) – that’s a good benchmark for knowing how the market continues to improve. The fluctuation of monthly averages has to do with the type of inventory sold. The lower sales are homes that needed updating and did not show well, no matter how good the homes may have been. We cannot stress enough the importance of staging and decluttering in order for you to get top dollar for your home. Give us a call for a no obligation, consultation of your home. Remember that I have an architectural background and will help you stage your property in order to get the highest price possible.
Coming Soon to Miami Shores
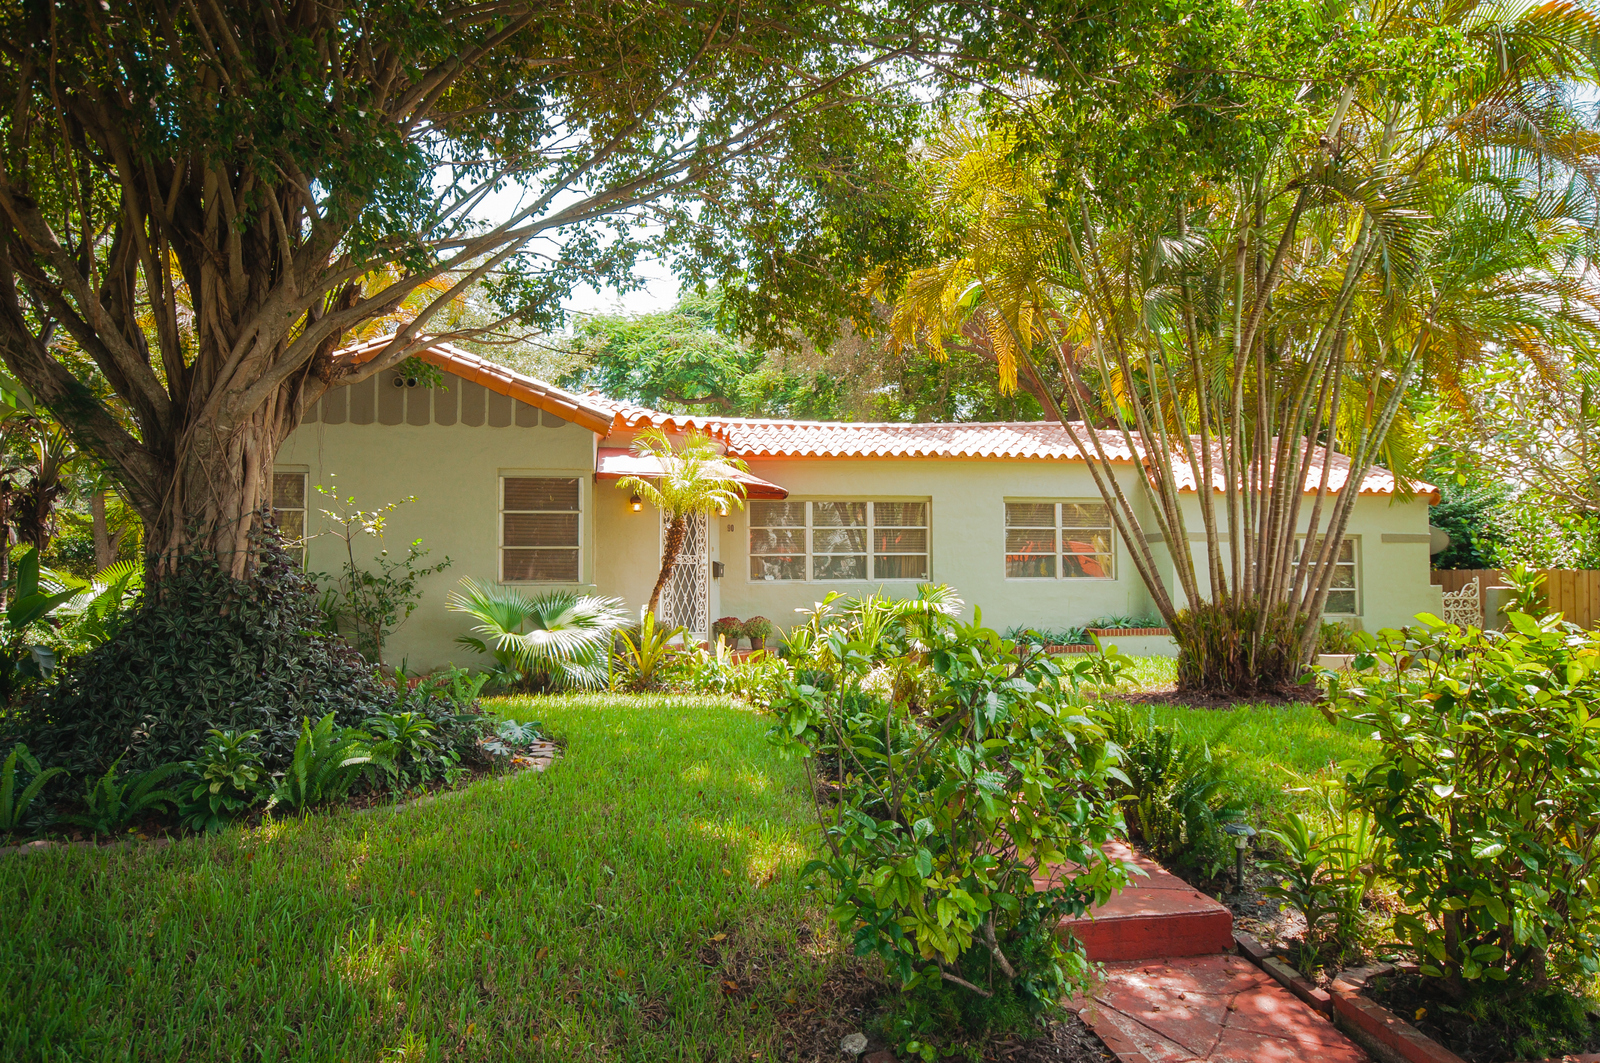
The Miamism Sales Team is happy to announce a beautiful listing that will be ready for showings soon. We are excited about this one because of the great architectural details and charm: from open beamed ceilings, to drop-dead gorgeous quarry tile floors. Here’s a preview of the exterior facade:  It’s a 3 bedroom / 2 bathroom home on a corner lot with 11,043 sq.ft. Please contact us for more information and to coordinate a showing appointment.
To sign up to our Home Trend Reports, go to MiamismTRENDS.com and fill in your information. Call us Today for a listing appointment! If you are interested in getting a list of all properties currently for sale in Miami Shores, we will be happy to send you a digital copy at your request. We can also send you monthly market reports directly to your inbox. Feel free to email us at MiamiShores@miamism.com Miamism.com has a new property search system where you get access directly to the MLS (Multiple Listing Service) – take a look:
How’s the Miami Shores Real Estate Market Doing? August 2015 http://t.co/UcW88cCO5p http://t.co/ej3j5HhTsy
RT @ines: How’s the Miami Shores Real Estate Market Doing? August 2015 http://t.co/UcW88cCO5p http://t.co/ej3j5HhTsy
How’s the Miami Shores Real Estate Market Doing? August 2015 – http://t.co/LXJ7tKwPWG (via@ines)