Surfside Real Estate Market Report – June 2019
How is the Surfside Real Estate Market Doing?
There are currently 53 Surfside homes for sale: (compared to 49 last month)
-
Highest priced listing: $5,250,000 for the waterfront home at Biscaya Island, located at 1413 Biscaya Dr with 6 bedrooms / 6.5 bathrooms, 6,072 SF on 10,709 SF lot with 68′ of water frontage.
-
Lowest priced listing: $535,000 for the 3 bedroom / 2 bathroom home at 8838 Harding Ave
-
Pending Sales: 5
-
Closed Sales in June: 5 (compared to 3 in May)
-
Median Sales Price in June: $699,999

The 5 Surfside homes sold in June were the following:
- 8842 Dickens Ave – 3 bedrooms / 2 bathrooms, 1,516 SF on 5,600 SF lot – completely renovated home. Listed for $699,000 in February, reduced to $670,000 in March and selling for $610,000 ($402/SF)
- 9324 Carlyle Ave – 3 bedrooms / 2 bathrooms, 2,035 SF on 5,600 SF lot. Listed for $720,000 in April and selling for $645,000 ($344/SF)
- 9509 Byron Ave – 3 bedrooms / 2 bathrooms, 2,064 SF on 5,600 SF lot. Listed for $799,900 in July of 2018 and selling for $699,999 ($368/SF)
- 401 93 St – 3 bedrooms / 2 bathrooms, 1,954 SF on 5,292 SF lot. Originally listed for $964,500 in August of 2018, had several price reductions and finally sold for $840,000 ($421/SF) **cash transaction
- 400 90 St – 3 bedrooms / 3.5 bathrooms, 2,784 SF on 6,860 SF lot. Brand new construction originally listed for $1.4 Million in December of 2017, with several price reductions and selling for $1,135,000 ($417/SF)
The average price per square foot in June for Surfside homes not on the water was $391, compared to previous months:
- May’s average $446
- April’s average $337
- March’s average $410
- February’s average $352 (1 sale)
- January’s average **no sales
- 2018’s average $360
There were no waterfront sales in the month of June in Surfside and therefore, no average. The average price per square foot in previous months was:
- May’s average $852 (one sale)
- April’s average $756 (one sale)
- March’s average **no sales
- February’s average $598
- January’s average $690
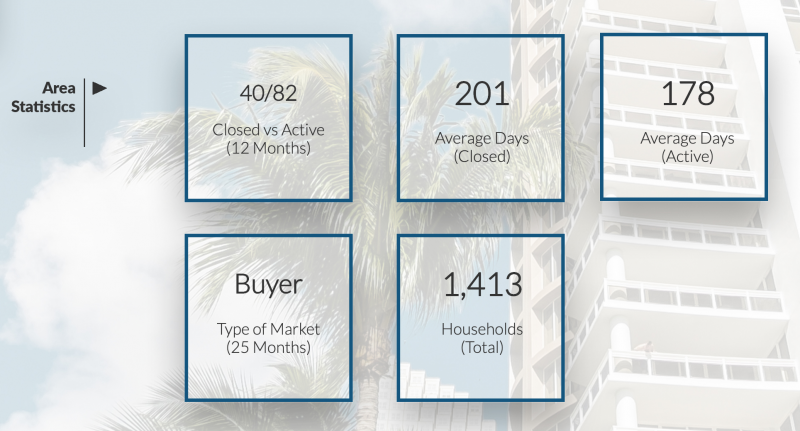
The market continues to favor buyers and inventory points to 25 months of inventory if sales continue at the current rate. We have a new, downloadable market report with interesting stats like cash/financed deals, where buyers are coming from, percentage of homeowners/investors and analytics of price per square foot per bedroom. Did you know that 3 bedroom homes in Surfside sell for more than 4 bedroom homes? CLICK HERE TO DOWNLOAD REPORT.

The Market Action Index remained at 26, which still shows slight buyer’s advantage.
Slight Buyer’s Advantage
The market has shown some evidence of slowing recently. Both prices and inventory levels are relatively unchanged in recent weeks. Watch the Market Action Index for changes as it can be a leading indicator for price changes.
Contact us for a complimentary evaluation of your home.
