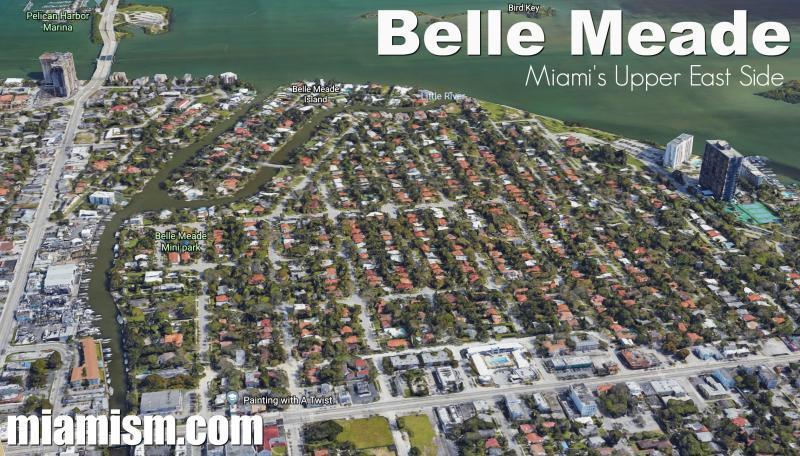
How is The Belle Meade Real Estate Market Doing?
There are currently 21 single-family homes for sale
- Highest priced listing is
$7,850,000$7,495,000 for the bay front, new construction home at 7311 Belle Meade Island Dr. - Lowest priced listing is
$499,900$479,900 for the 2/2 foreclosure at 810 NE 75 St - Pending Sales (Properties under contract): 5
- Median Sales Price in July: $695,000
- Closed sales in September: 3
There 3 Belle Meade homes sold in September were the following:
- 726 NE 72 Ter – 2 bedrooms / 2 bathroom with 1,377 SF on 6,000 SF lot. Originally listed for $699,900 in July and sold for $665,000 ($485/SF)
- 711 NE 72 Ter – 3 bedrooms / 2 bathrooms with 1,649 SF on 5,900 SF lot. Originally listed for $729,000 in July and sold for $695,000 ($422/SF)
- 844 NE Belle Meade Island Dr – waterfront 2 bedrooms / 2 bathrooms with 2,324 SF on 13,711 SF lot with 125′ of water frontage. Originally listed for $1,300,000 in August and sold for $1,257,750 ($673/SF)
Average price per square foot for Belle Meade homes not on the water in September was $454, compared to previous months:
- August’s average $298 (one sale)
- July’s average $328
- June’s average –no sales
- May’s average $365
- April’s average $399
- March’s average $369 (one sale)
- February’s average $374
- January’s average $294 (one sale)
- 2018’s average (not on the water) $356
There was one waterfront home sold in Belle Meade in September, selling for $673/SF. The price per square foot for homes on the water in previous months was:
- August’s average $306 (one sale) **unbuilt land with plans
- July’s average $687 (one sale)
- June’s average – no sales
- May’s average – $796 (one sale)
- April’s average – no sales
- March’s average – no sales
- February’s average $414 (one sale)
- January’s average – no sales
- 2018’s average (waterfront) $683
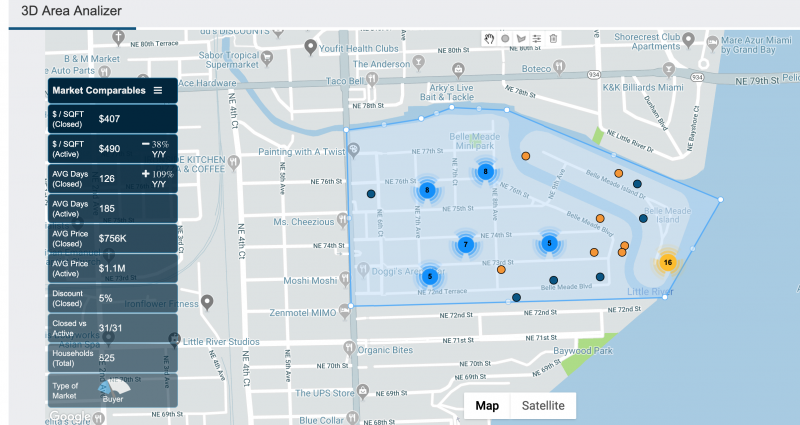
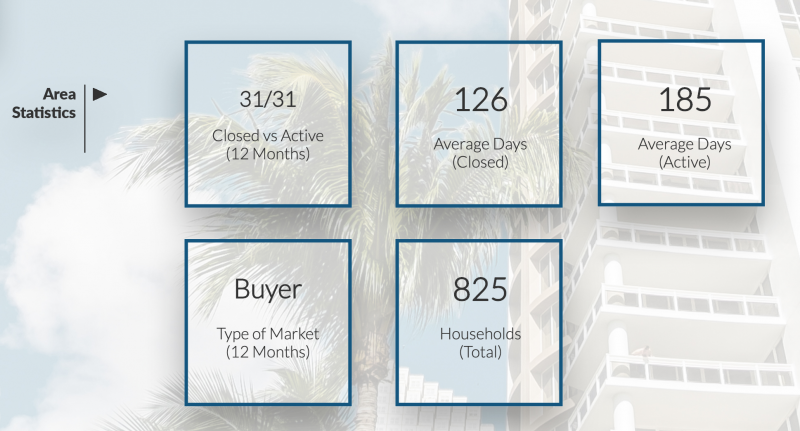
There are 12 months of inventory in Belle Meade at the moment and only 25.8% of the market is investors.

The Market Action Index for 33138 is at 27 and showing a slight buyer’s advantage.
Our new market reports are available to you upon request or once a month if you request to be added to our mailing list. (We don’t spam and only send relevant content you request).
The micro data we provide in our reports is unparalleled showing where buyers are coming from, discount averages for the area as well as disparities in pricing by bedrooms, property size, and even year built. Belle Meade homes sold before 1947 are selling more than anything else, followed by homes built between 2000-2009. The price range that is moving the most is between $500,000 and $700,000.
For a free copy of this report, click HERE.
And finally, for a no-obligation home value report, visit MiamismValue.com or contact us for a consultation.