Annual Overview: Keystone Point 2024 Real Estate Market – Key Trends and Analysis
Embark on your Keystone Point real estate journey with expert guidance that makes the process not only seamless but genuinely enjoyable. The Keystone Point real estate market in 2024 showcased its distinct character and resilience. Amid fluctuating wider market conditions, Keystone Point remained a sought-after enclave, known for its luxurious waterfront properties and strategic location.
Cracking the Pricing Code
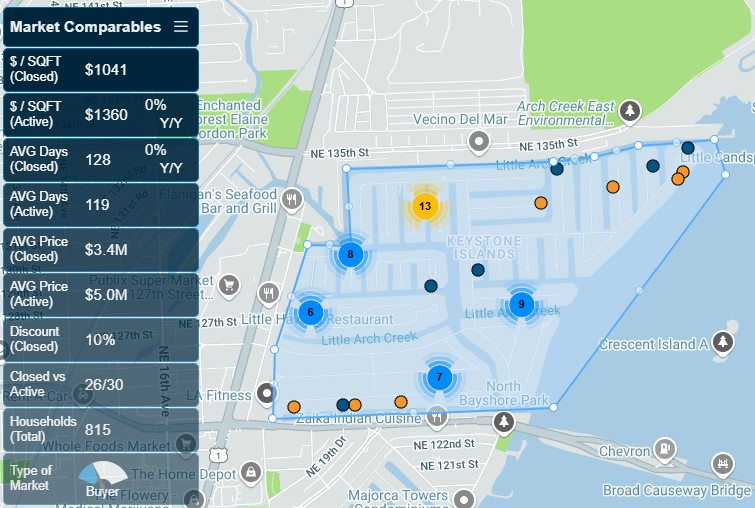
In Keystone Point, 2024 revealed a clear gap between seller expectations and market realities. With active listings averaging $5.0 million compared to the $3.4 million closing prices, the market dynamics required negotiations, where sellers generally accepted a 10% discount on deals. This discrepancy underscores the necessity for sellers to align their expectations with the prevailing market sentiments to facilitate transactions.
The Pace of Play
The Keystone Point market maintained a thoughtful pace in 2024. Properties averaged 128 days on the market before selling, slightly longer than the time current listings have been active at 119 days. This pace indicates a market that values deliberate decision-making, allowing both buyers and sellers to negotiate thoroughly and avoid rushed conclusions.
Finding the Sweet Spot
The analysis of 2024’s transactions shows a significant distinction in valuation between sold and currently listed properties. Closed properties achieved an average of $1,041 per square foot, whereas active listings aim higher at $1,360 per square foot. Homes that are well-appointed and competitively priced capture buyer interest more quickly, highlighting the premium on realistic pricing and market-awareness.
What This Means for You
This year’s market activity in Keystone Point accentuates the importance of precision in pricing and presentation. Sellers with well-priced, appealing properties tend to navigate the market more successfully, while buyers remain selective, favoring homes that offer both value and luxury.
Looking Ahead to 2025
Moving forward into 2025, the Keystone Point real estate market is poised for continued interest from discerning buyers and investors. The stability seen in 2024 is encouraging, suggesting that those prepared to engage with the market’s dynamics—understanding pricing trends and buyer expectations—will find opportunities for success.
Join us as we navigate another promising year in Keystone Point. Whether buying or selling, aligning with knowledgeable professionals can transform complex market interactions into rewarding real estate achievements.
Download our latest 3-D Market Analyzer HERE.
Keystone Point Waterfront Homes – Price per Square Foot
Take a look at the changes in average price per square foot for homes on the water in Keystone Point:
| Year | Price per SF |
|---|---|
| 2024 | $1,056/SF |
| 2023 | $1,008/SF |
| 2022 | $1,052/SF |
| 2021 | $700/SF |
| 2020 | $522/SF |
| 2019 | $416/SF |
| 2018 | $476/SF |
| 2017 | $421/SF |
| 2016 | $432/SF |
| 2015 | $441/SF |
| 2014 | $395/SF |
| 2013 | $328/SF |
After a downturn in 2023, Keystone Point’s real estate market has corrected, with prices in 2024 rising to $1,056 per square foot, now exceeding the 2022 levels. This adjustment indicates that while expectations may have been overly optimistic during the previous year, the market is realigning, reflecting a more realistic stance from sellers and stabilizing to support sustained growth.
Take a look at the benchmark for Keystone Point in the last 12 months:

Here are the key insights from this market data:
PRICING DISCONNECT
– There’s a significant gap between closed prices ($3.4M) and active listings ($5.0M) – a $1.6M difference
– This suggests sellers might be overpricing their properties in the current market
– The 10% average discount on closed properties indicates buyers are successfully negotiating lower prices
MARKET ACTIVITY
– With 26 closed sales out of 815 total households, only about 3.2% of homes sold in the past year
– The nearly equal number of active listings (30) to closed sales (26) suggests a balanced market
– However, this could trend toward a buyer’s market if active listings continue to accumulate
MARKET VELOCITY
– Average days on market for both closed (128) and active (119) properties are relatively similar
– The 4+ month average selling time suggests this is not a fast-moving market
– This could be due to the high price point of properties in this market
Download our latest 3-D Market Analyzer HERE.
Keystone Point Real Estate Market Report for 2024
The general figures for Miami Shores homes in 2024 are the following: (click HERE to see 2023 figures)
- There were 37 Keystone Homes sold in 2024, compared to 20 in 2023, and 43 in 2022. The median sales price was $2.3 Million, compared to $2.2 Million in 2023 and 2022.
- The highest sale in Keystone Point in 2024 was for the bay-front lot at 12455 Keystone Island Dr, selling for $6.85 Million. That was a 15,393 Sq.Ft. lot with 103′ of open bay frontage. **Cash transaction
- The highest home sale in Keystone Point in 2024 was for the 1972 bay-front home at 13255 Biscayne Bay Dr with 4 bedrooms / 3.5 bathrooms, 5,040 Sq. Ft. of living area on 15,270 Sq. Ft. lot with 102′ of open bay frontage. Selling for $6.4 Million ($1,270/Sq.Ft.) **Cash Transaction
- The highest price per square foot sale was $1,524 for the canal front home at 13000 Ortega Ln – a 1957 home with 3 bedrooms / 3 bathrooms, 2,133 Sq.Ft. on a 10,221 Sq.Ft. lot with 82′ of canal frontage
List of Keystone Homes Sold in 2024

To get a list of all Keystone Point homes sold in 2024, please contact us.
Download our latest 3-D Market Analyzer HERE.
Ready to explore opportunities in Keystone Point’s evolving market? Contact us today to navigate your next real estate venture with confidence and expert guidance
