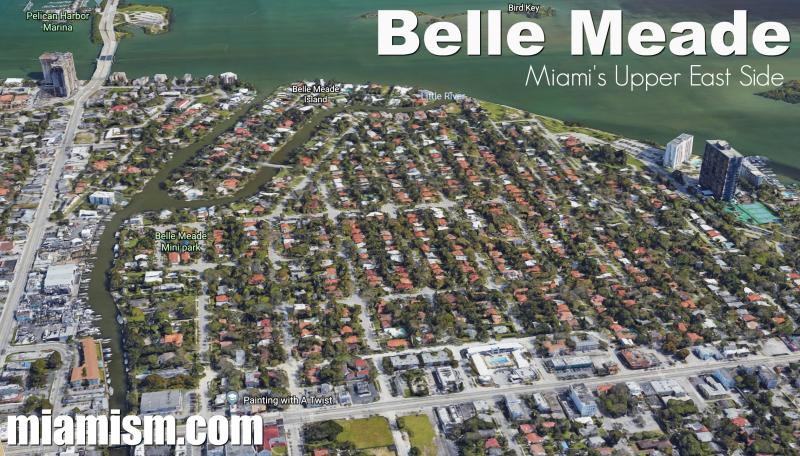
Belle Meade Real Estate Market Report for 2018
It’s time to share 2018 stats for Belle Meade to understand how the real estate market stands against the rest of Miami. Several smaller neighborhoods have had little movement in the past 6-8 months but their markets have remained strong. This means that prices have not dropped, but instead, there have not been a lot of sales.
We provide monthly market reports for Belle Meade on the last week of every month to help you stay informed about the value of your home and fluctuations in our local market. We work hard to provide these stats and hope you consider us when you are ready to sell your property. We can even provide a personalized home value analysis at any time, without obligation. You would be surprised how many times we tell our clients to hold on to their property a bit longer in order to make a better return.
With that said, we also offer REAL-TIME reports that will give you precise and specific, up-to-the-minute stats.
There were 26 homes sold in Belle Meade in 2018, and 6 of them were waterfront. Next will give you different stats, including changes in average price per square foot.
Belle Meade Waterfront Homes – Price per Square Foot
Take a look at the changes in average price per square foot for homes on the water in Belle Meade:
| Year | Price per SF | Number of Sales |
|---|---|---|
| 2018 | $683/SF | 6 |
| 2017 | $646/SF | 3 |
| 2016 | $450/SF | 4 |
In 2016, there were no waterfront sales in Belle Meade above $1.5 Million, with the highest price per square foot coming in at $599 and lowest was $273. In 2017, there were only 3 waterfront sales, with the highest being $4.3 Million and lowest $1,050,000 – the highest price per square foot was $738 and lowest was $576. In 2018, there were 6 waterfront sales in Belle Meade with the highest being at $6.25 Million and lowest at $1,089,500 – the highest price per square foot was $816 and the lowest $538.
Please keep in mind that Belle Meade has different types of waterfront and this makes a huge difference when making comparisons. You will have canal-front homes facing the marina. You will have Belle Meade Island homes on the canal or open bay and you will have bay-front homes on actual Belle Meade. Although there are not a lot of sales to be able to make the right comparisons, Belle Meade Island because of its double privacy (second security gate), is more desirable and we have seen new construction in the past few years, bringing upper luxury tier to the area.
The highest priced waterfront home in Belle Meade right now is asking $8.45 Million (new construction bay front on Belle Meade Island), and the lowest priced waterfront home is asking $1.695 Million – canal front facing Belle Meade Island.
Belle Meade Dry-Lot Homes – Price per Square Foot
Take a look at the changes in average price per square foot for homes NOT on the water in Belle Meade:
| Year | Price per SF |
|---|---|
| 2018 | $356/SF |
| 2017 | $361/SF |
| 2016 | $347/SF |
It’s interesting to see a slight decrease in price per square foot from 2017 to 2018 but notice it’s only a difference of $5. Because of the lack of movement in Belle Meade, this actually identifies the area as a stable market. A lot of the sales in 2018 were fixer-uppers, which also affects this figure. This will be a number to keep a close eye on in 2019, especially with all the remodeling and construction evident in the area.
In 2016, the highest priced sale in Belle Meade for a non-waterfront home was $840,000 compared to $739,000 in 2017 and $949,000 in 2018.
Belle Meade Real Estate Market Report for 2018
The general figures for Belle Meade homes in 2018 are the following:
- There were 26 Belle Meade homes sold in 2018. The median sales price was $637,500 compared to $592,500 in 2017.
- The highest sale in Belle Meade in 2018 was for the bay front home located in Belle Meade Island at 7301 Belle Meade Island Dr. This was a 7 bedroom / 7.5 bathroom home with almost 8,000 SF of living space, a 29,452 SF lot with 300′ of bay frontage. The home had been listed originally for $6,999,999 in May of 2016 and sold for $6.25 Million in February of 2018, at $816/SF.
- The lowest Belle Meade home sold in 2018 was a foreclosure located at 7291 NE 8th Ave. This 2 bedroom / 2 bathroom home was not on the water and had been originally listed for $550,000 and sold for $440,654. This home was remodeled, flipped and put back on the market for $675,000 and is currently under contract with a last listing price of $599,000.
- There was only one distressed sale in 2018 in Belle Meade and it’s the house mentioned above.
- The highest sale for a dry-lot home in Belle Meade was $949,000 for the home at 1000 NE 72 Ter, a 3 bedroom / 3.5 bathroom home with over 3,000 SF of living space, on an oversized 21,700 SF lot. Selling for $302/SF.
- The average price per square foot in Belle Meade coming in at $432, compared to $401 in 2017 and $363 in 2016.
List of Belle Meade Homes Sold in 2018
To get a list of all Belle Meade homes sold in 2018, please contact us.