
Keystone Point Real Estate Market Report for 2019
There were some drastic changes in the Keystone Point Real Estate Market in 2019 which will be evident in the data we are providing below. There was a massive drop in average price per square foot (which includes both waterfront and non-waterfront homes). And when you separate waterfront from non-waterfront – dry lots evidenced a slight increase, while water a 50 point drop.
Please note that we provide monthly stats for Keystone point on a monthly basis. We can send these automatically to your inbox, or you can visit miamism.com to read on your own.
We also have a really comprehensive 3D market analysis upon request that includes micro-data for the area in the last 12 months. To see the latest report, please click HERE.
Did you know that 35% of Keystone Point sales are CASH? Also, it’s one of the only areas in Miami without foreign national buyers and only 23.7% owners are investors. We can now provide granular data that will help you identify the right time to buy or sell and for the correct price.
Keystone Point Waterfront Homes – Price per Square Foot
Take a look at the changes in average price per square foot for homes on the water in Keystone Point:
| Year | Price per SF |
|---|---|
| 2019 | $416/SF |
| 2018 | $476/SF |
| 2017 | $421/SF |
| 2016 | $432/SF |
| 2015 | $441/SF |
| 2014 | $395/SF |
| 2013 | $328/SF |
Keystone Point’s pricing continues to fluctuate and the reason may not be as simple as you think. Because inventory is so limited, average pricing depends on condition of homes that have sold and when those happen to be fixer uppers or knock-downs, then that average drastically drops. Keystone then become even more of a hyper-local real estate market where it’s crucial to know the properties and their condition to make smart analysis and as the saying goes, “compare apples to apples”.
The lowest sale in 2019 in Keystone was a non-waterfront foreclosure that sold for $416,500 in April (cash transaction). The highest sale was for a waterfront home built in 2007 that was originally listed in 2018 for $3,999,500 and sold for $2.75 Million in September of 2019.
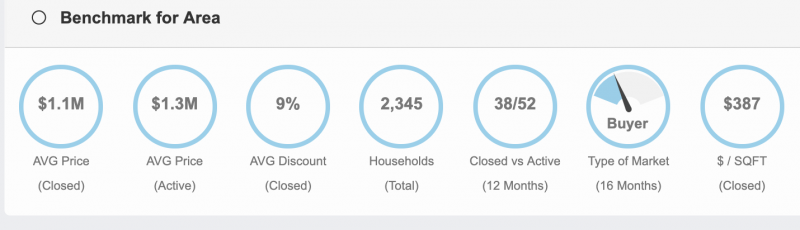
Keystone’s inventory of homes varies drastically and areas within Keystone sell with huge disparities. Lesson is to work with someone that knows the area and the inventory and gives you the reality of the market. Right now, it’s a buyer’s market with 16 months of inventory (at the current rate of sales, it will take 16 months to sell all the homes that are currently for sale).
Keystone Point Dry-Lot Homes – Price per Square Foot
Take a look at the changes in average price per square foot for homes NOT on the water in Keystone Point:
| Year | Price per SF |
|---|---|
| 2019 | $306/SF |
| 2018 | $303/SF |
| 2017 | $285/SF |
| 2016 | $287/SF |
| 2015 | $273/SF |
| 2014 | $230/SF |
| 2013 | $190/SF |
28% of Keystone’s sales In 2019 were non-waterfront homes with 11 homes sold. The highest non-waterfront sale was a new construction home at 1950 Alamanda Drive, selling for $1.2 Million or $444/SF.
The highest priced home currently listed in Keystone right now is for the completely remodeled home at 1965 S Hibiscus Dr, listed for $1,299,000. The lowest priced home currently listed in Keystone is $579,000 for the 50’s home at 1905 Alamanda Dr.
Keystone Point Real Estate Market Report for 2019
The general figures for Keystone Point homes in 2019 are the following: (click HERE to see stats from 2018)
- There were 40 Keystone Point homes sold in 2019. The median sales price was $976,800, compared to $1,175,000 in 2018, $887,500 in 2017, and $975,000 in 2016.
- The highest sale in Keystone Point in 2019 was for the 2007 built, waterfront home at 2391 Bayview Lane. This 6 bedroom / 5 bathroom home with 6,499 SF of living space, 13,134 SF lot with 174′ of water frontage, sold for $2.75 Million in October at $423/SF and was a cash transaction.
- The lowest waterfront Keystone Point home sold in 2019 was located at 2170 NE 124th Street, with a fixed bridge. This home has 2 bedrooms / 3 bathrooms, 2,076 SF of living space, 11,250 SF lot and 75′ of water frontage. It sold in February 2019 for $820,000 or $395/SF with a conventional loan.
- 2 of the 40 homes sold in 2019 were distressed sales, meaning no short sales or foreclosures.
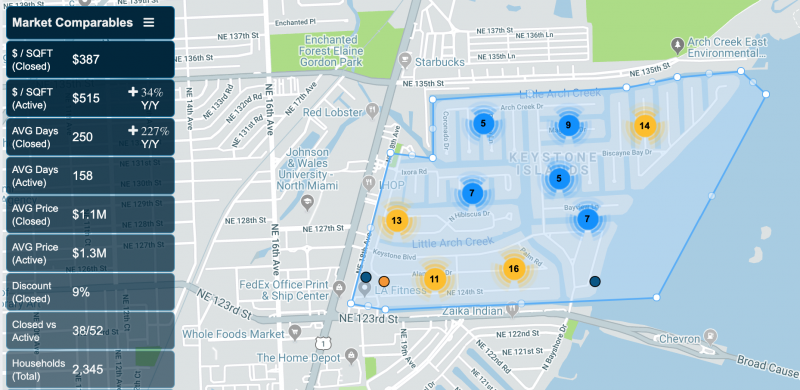
- The average price per square foot in Keystone Point coming in at $387, compared to $447 in 2018, and $381 in 2017.
List of Keystone Point Homes Sold in 2019
To get a list of all Keystone Point homes sold in 2019, please contact us.