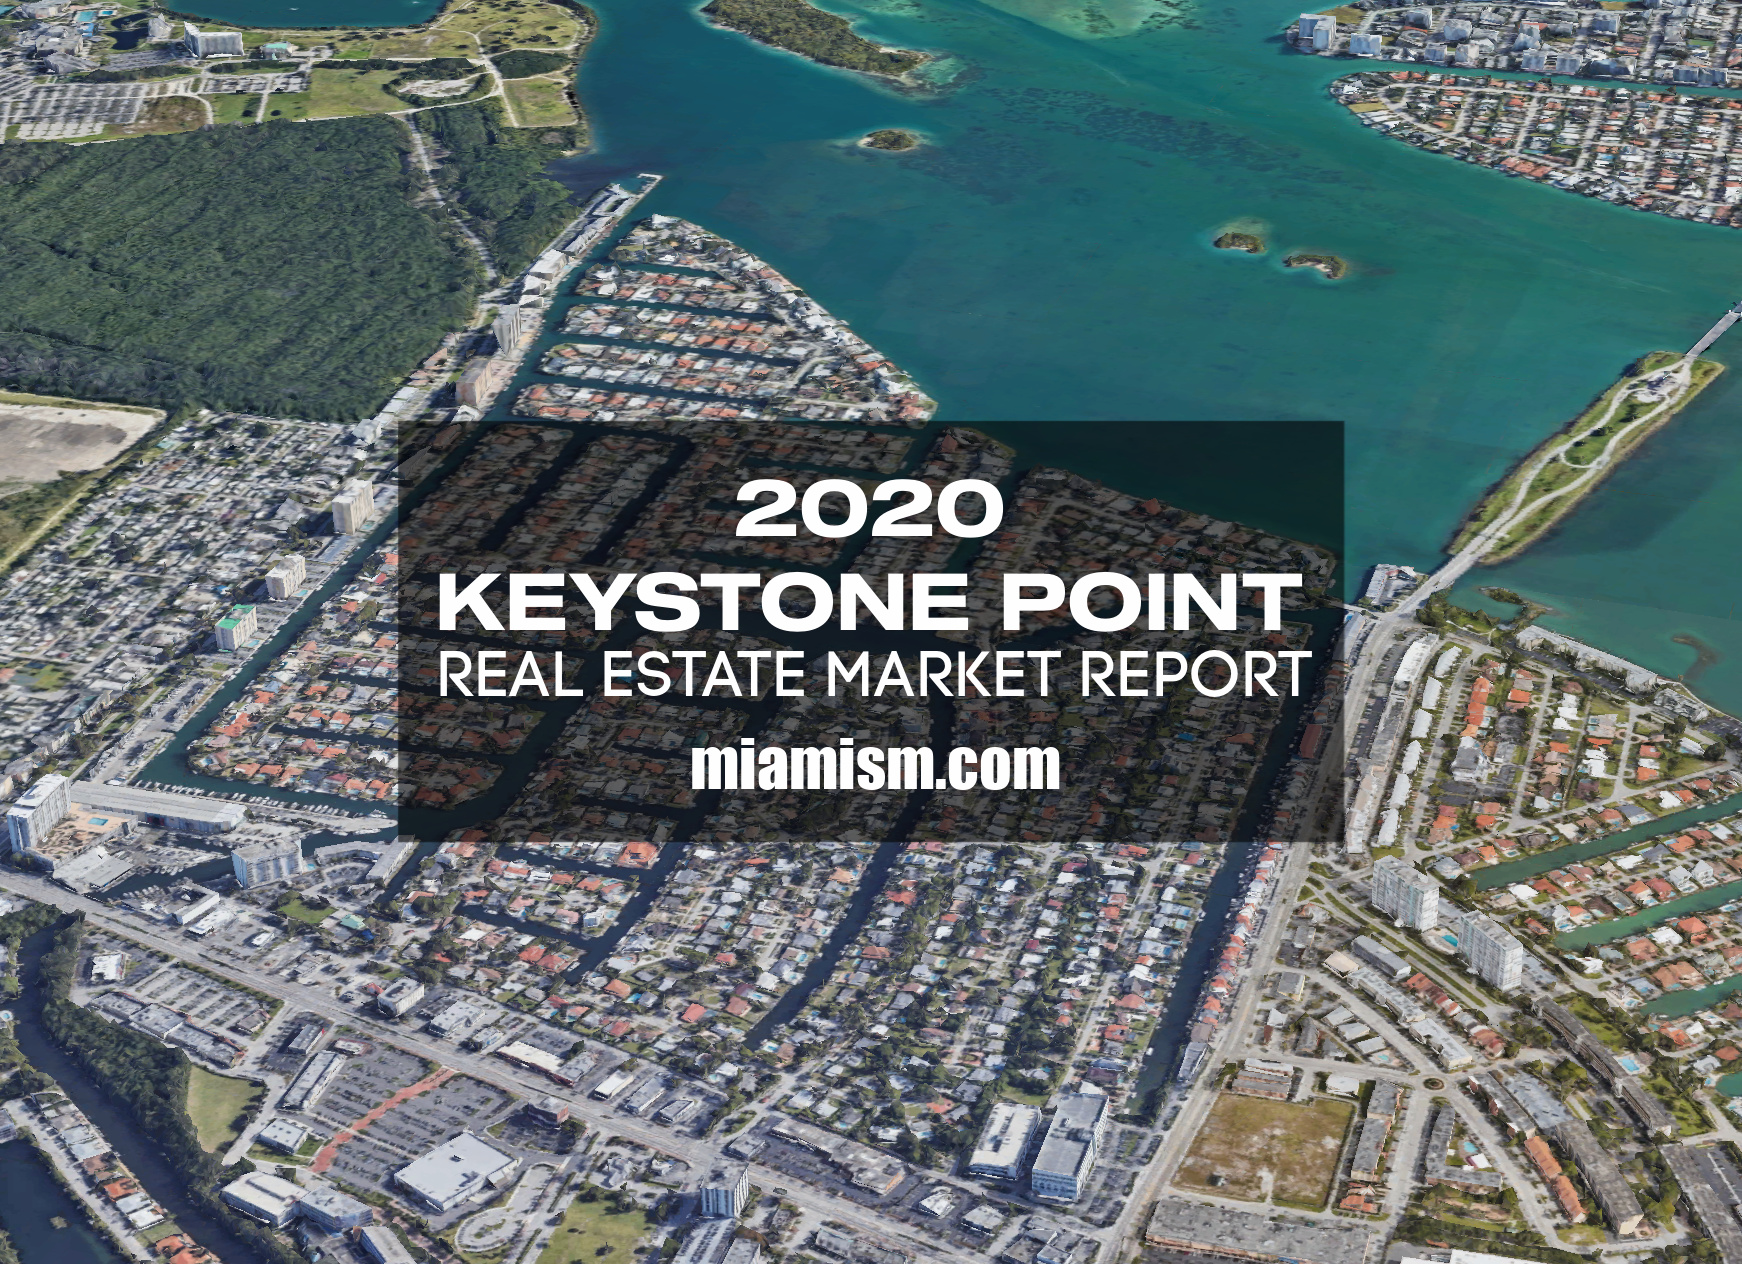
Keystone Point Real Estate Market Report for 2020
Let’s just start by saying, KEYSTONE POINT is back!! Yes ladies and gents, after we saw a price drop per square foot from 2018 to 2019, we are currently in a hot seller’s market with a huge increase to $522/SF!! That’s called recovery! There are 3 months of inventory right now, meaning that at the current rate of sales, it would take 3 months for all homes on the market to be sold. We are seeing a huge increase in demand and the average price is $1.4 million.
Keystone’s sweet spot right now when it comes to price range that is moving the most, is between $1 Million and $1.5 Million and 46.2% of all sales in 2020 were cash transactions. Buyers are not just local, New Yorkers are loving the low prices and we have a buyer influx from Argentina as well.
Please keep in mind that the neighborhood remains pretty local with 67.5% of sales being for primary residences (not second homes and not for investments).
We prepare monthly Keystone Point market reports on the third week of each month and we also have a really comprehensive 3D market analysis upon request that includes micro-data for the area in the last 12 months. To see the latest report, please click HERE.
Keystone Point Waterfront Homes – Price per Square Foot
Take a look at the changes in average price per square foot for homes on the water in Keystone Point:
| Year | Price per SF |
|---|---|
| 2020 | $522/SF |
| 2019 | $416/SF |
| 2018 | $476/SF |
| 2017 | $421/SF |
| 2016 | $432/SF |
| 2015 | $441/SF |
| 2014 | $395/SF |
| 2013 | $328/SF |
Keystone Point’s waterfront homes continue to entice because they are inexpensive compared to neighboring Bay Harbor Islands and Miami Beach. Inventory is limited and we are seeing multiple-offer scenarios and even bidding wars. If you are interested in buying in Keystone, you may need to work with an aggressive and experienced agent to help you win the negotiation – and needless to say, the Miamism Sales Team has been through it and back!
The lowest sale in 2020 was a non-waterfront foreclosure at 2100 Alamanda Dr that was listed for $508,800 in April and sold for $428,500 ($203/SF) **cash transaction.
The highest sale was for the brand new construction with 6 bedrooms / 6.5 bathrooms, 6,043 SF on 10,498 SF lot with 121′ of water frontage. This home sold at list price of $3.39 Million ($561/SF) **cash transaction

Keystone went from a buyer’s market with 16 months of inventory to a HOT seller’s market with 3 months of inventory. Although it may seem easy to sell right now, It’s key that you understand negotiating strategies in a seller’s market. In order to maximize what you walk away with, make sure you work with someone that has sailed this ship before.
Download Keystone Point Waterfront Market Report
Keystone Point Real Estate Market Report for 2020
The general figures for Keystone Point homes in 2020 are the following: (click HERE to see stats from 2019)
- There were 51 Keystone Point homes sold in 2020 The median sales price was $1,100,000 compared to $976,800 in 2019, 1,175,000 in 2018, and $887,500 in 2017.
- The highest sale in Keystone Point in 2020 was for brand new, 2020 construction mentioned above, located at 12685 Hickory Rd, selling at $3,390,000 as a cash transaction.
- The lowest waterfront Keystone Point home sold in 2020 was located at 2006 NE 124th St. A 3 bedrooms / 2 bathroom home with 1,501 SF, on 11,250 SF lot with 75′ of water frontage (1 fixed bridge to bay), sold as rehab or tear down. This home sold for $593/SF as a cash transaction.
- 3 of the 51 homes sold in 2020 were distressed sales (foreclosures).
- The average price per square foot in Keystone Point coming in at $490, compared to $387 in 2019, $447 in 2018, and $381 in 2017.

Download Keystone Point Waterfront Market Report
List of Keystone Point Homes Sold in 2020
To get a list of all Keystone Point homes sold in 2020, please contact us