How is the Miami Shores Real Estate Market Doing?
There are currently 97 homes for sale: (compared to 99 last month)
- Highest priced listing is
$5,590,000$5,400,000 for the bay front home located at 9901 NE 13 Ave with 93′ of open bay frontage, 14,024 SF lot and almost 5,000 SF of living space.
- Lowest priced listing is $324,000 for the 2/1 fixer upper located at 19 NW 109th St.
- Pending Sales (Properties under contract): 28
- Median Sales Price in October: $612,000
- Closed sales in October: 18 (compared to 20 in September)
What sold in Miami Shores in October?
The 18 Miami Shores homes sold in October ranged from $1,423,000 for the historic, California Bungalow located on 9301 NE 9th Place (with 39,483 SF of land!), to $392,361 for the foreclosure at 73 NE 108th St. Price per square foot varied from $166 for the fixer upper at 210 NE 107th St to $422 for remodeled mid-century, east of Biscayne at 999 NE 94 St.
What is the average price per square foot in Miami Shores?
The average sold price per square foot in Miami Shores in October for homes not on the water was $296 compared to:
- September’s Average $319
- August’s Average $296
- July’s Average $328
- June’s Average $325
- May’s Average $341
- April’s Average $314
- March’s Average $331
- February’s Average $276
- January’s Average $327
- 2018’s average of $317.
There was one waterfront home sold in October in Miami Shores. The home is located in The West Country Club area with one fixed bridge at 1090 NE 105 St. It sold for $1,165,000 at $292/SF.
Miami Shores Opinion
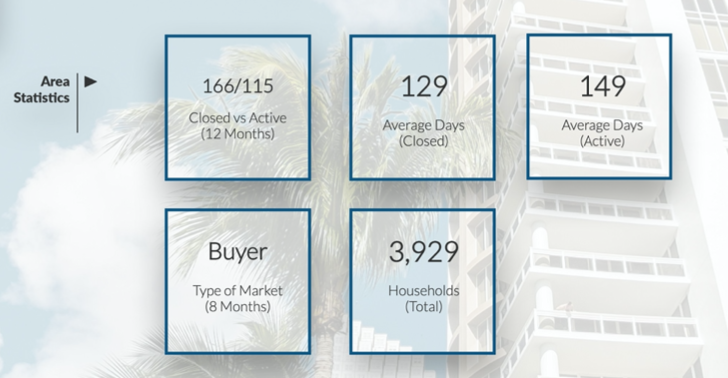
Miami Shores remains pretty stable with almost no changes from last month, except to one foreclosure sale that throw off monthly averages. We still have a buyer’s market with 8 months of inventory. Did you know that 30% of all Miami Shores sales are Cash and 29% of purchases are investors? Buyers for Miami Shores are not coming only from The U.S. These stats are key when you are planning to sell. Our micro-data helps you identify when it’s better to sell and for how much depending on certain features and elements of your home.
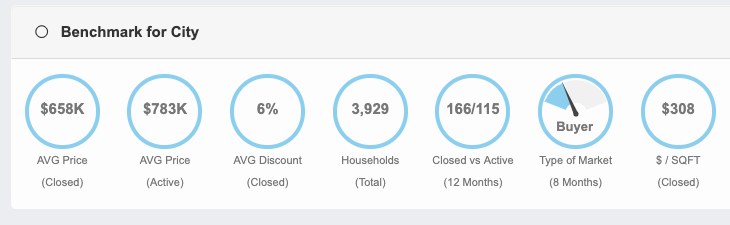
The average home price in the last 12 months has been $658,000 and there’s an average discount in the village of 6%. Countries buying in Miami Shores continues to impress us and is specially important when we market our listings abroad, to the right audience.
To ge a copy of our new micro-level market reports, please click HERE or contact us with your address and we’ll be happy to provide a physical copy.
Our real-time market reports indicate that the Market Action Index decreased to 29 which reflects a slight Buyer’s Advantage:
The market has shown some evidence of slowing recently. Both prices and inventory levels are relatively unchanged in recent weeks. Watch the Market Action Index for changes as it can be a leading indicator for price changes.
Additional Miami Shores Reports
In addition to these monthly reports that we prepare the first week of each month, we also have our REAL-TIME reports that you can sign up with or request a home value report from MiamismValue.com.
CONTACT us if you are thinking of selling. We would be happy to meet and give you our opinion on your home.