
How is the Surfside Real Estate Market Doing?
There are currently 48 Surfside homes for sale: (compared to 53 last month)
-
Highest priced listing: $5,250,000 for the waterfront home at Biscaya Island, located at 1413 Biscaya Dr with 6 bedrooms / 6.5 bathrooms, 6,072 SF on 10,709 SF lot with 68′ of water frontage.
-
Lowest priced listing:
$535,000$495,000 for the 3 bedroom / 2 bathroom home at 8838 Harding Ave -
Pending Sales: 6
-
Closed Sales in July: 3 (compared to 5 in June)
-
Median Sales Price in July: $700,000
The 3 Surfside homes sold in July were the following:
- 8811 Dickens Ave – 3 bedrooms / 2 bathrooms, 2,184 SF on 5,600 SF lot. Listed for $695,000 in March and sold for $630,000 ($297/SF)
- 8919 Hawthorne Ave – 3 bedrooms / 3 bathrooms, 1,906 SF on 5,600 SF lot. Listed for $739,000 in February and selling for $700,000 ($367/SF) **cash transaction
- 9065 Emerson Ave – 4 bedrooms / 3 bathrooms, 1,884 SF on 5,600 SF lot. Listed for $795,000 in June and sold for $760,000 ($476/SF)
The average price per square foot in July for Surfside homes not on the water was $380, compared to previous months:
- June’s average $391
- May’s average $446
- April’s average $337
- March’s average $410
- February’s average $352 (1 sale)
- January’s average **no sales
- 2018’s average $360
There were no waterfront sales in the month of July in Surfside and therefore, no average. The average price per square foot in previous months was:
- June’s average **no sales
- May’s average $852 (one sale)
- April’s average $756 (one sale)
- March’s average **no sales
- February’s average $598
- January’s average $690
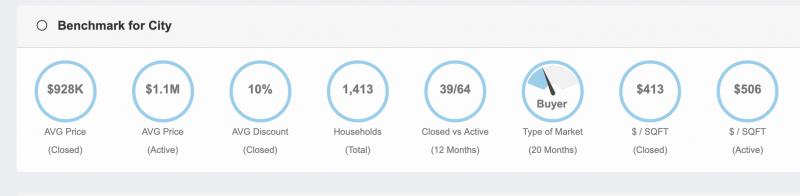
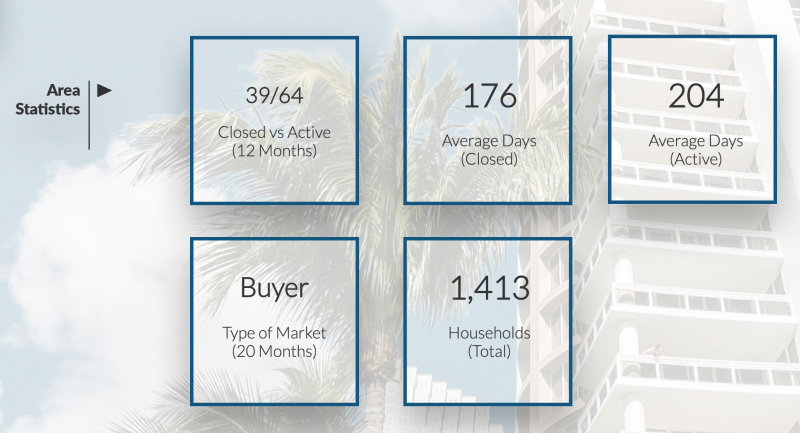
It is still a buyer’s market in Surfside with over 20 months of inventory. Please notice the disparity in selling price per square foot in July’s sales – this has to do with condition and location of homes. Our new reports, which you can DOWNLOAD HERE, use the last 12 months of data, for you to make an educated decision about buying or selling depending on robust data.
Interesting stats to mention, when you break down different factors is the disparity in pricing between 2, 3 and 4 bedroom homes. 2 bedroom homes have sold for an average of $345/SF, compared to $401/SF for 3 bedrooms and $410/SF for 4 bedroom homes. The homes that are most sold are built between 1950-1969 and average $456/SF, the second most sold period built is between 1970-1979 and those average $388/SF.
The Micro data we produce will educate you on real estate market conditions and will empower you into making the right move.
The Market Action Index continues at 26, which still shows slight buyer’s advantage.
Slight Buyer’s Advantage
The Market Action Index has been trending lower for several weeks while prices have remained relatively stable. If inventory continues to grow relative to demand however, it is likely that we will see downward pressure on pricing.
Please contact us when you are ready to buy and sell in Surfside – click here for a complimentary evaluation of your home.