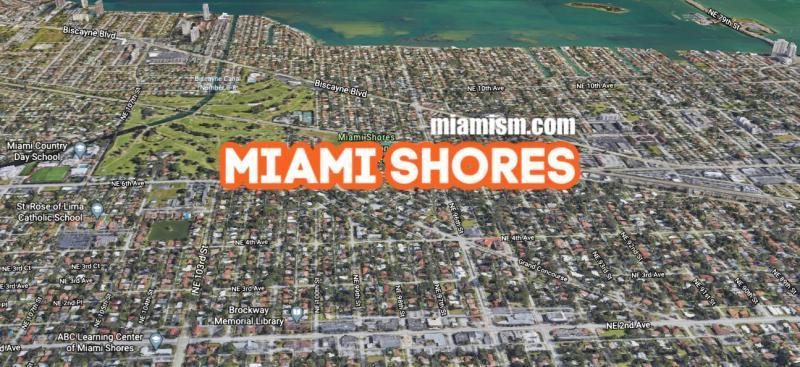
Miami Shores Real Estate – monthly market report – July 2021
How is the Miami Shores Real Estate Market Doing?
There are currently 35 homes for sale: (compared to 37 in June)
- Highest priced listing $8.5 Million for the 5/4.5 bay front home at 9999 NE 13th Avenue with 83′ of open bay water frontage ($2,163/SF)
- Lowest priced listing is $675,000 for a 2 bedroom / 2 bathroom home with 1,800 SF on 5,750 SF lot.($375/SF)
- Pending Sales (Properties under contract): 32
- Median Sales Price in July: $865,000
- Closed sales in July: 20 (same as June)
DOWNLOAD MIAMISM 3D MARKET ANALYZER REPORT
What sold in Miami Shores last month?
For a list of all Miami Shores homes sold in July please email us at MiamiShores@miamism.com
DOWNLOAD MIAMISM 3D MARKET ANALYZER REPORT
What is the average price per square foot in Miami Shores?
The average sold price per square foot in Miami Shores in July for homes not on the water was $449 compared to:
- June’s average $455
- May’s average $402
- April’s average $435
- March’s average $421
- February’s average $368
- January’s average $332
- 2020’s average of $338
There was one waterfront home sold in Miami Shores in July, selling at $1,453 per square foot, previous months’ averages as follows:
- June’s average – no sales
- May’s average – no sales
- April’s average – $593 (1 sale)
- March’s average – $321 (1 sale)
- February’s average – $550 (1 sale – fixed bridge)
- January’s average – no waterfront sales
DOWNLOAD MIAMISM 3D MARKET ANALYZER REPORT
Top 3 Sales in Miami Shores in July (by square footage)
- Bayfront home at 9767 NE 13th Ave, with 28,047 SF of land and 187′ of wide bay frontage that includes an oversized dock. Home was sold as development opportunity with option to build 2 homes or 1 custom mega-mansion. The existing home has 5 bedrooms / 4.5 bathrooms, 5,094 SF of living space. It was originally listed for $6.5 Million in April of 2021, increased to $7,495,000 and sold for $7.4 Million ($1,453/SF) **cash transaction
- New construction at 10603 NE 11th Ave with 4 bedrooms / 3 bathrooms / 2 half-baths, 2,760 SF on 11,700 SF lot. Sold turn-key (furnished). Originally listed for $1,750,000 in February of 2021, increased to $1,850,000 and sold for $1,800,000 ($652/SF)
- Beautiful mid-century at 515 NE 96th St with 4 bedrooms / 3 bathrooms / 2 half-baths, 2,145 SF on 13,000 SF lot. Originally listed for $1,049,000 in January of 2019, lowered a few times and canceled, relisted in March of 2021 for $1,299,000 and sold for $1,280,000 ($597/SF)
DOWNLOAD MIAMISM 3D MARKET ANALYZER REPORT
Miami Shores Opinion
We provide a comprehensive 3D market report with in-depth data from the last 12 months that you can download HERE.

Some key points you should know:
- 2 months of inventory and aggressive SELLER’s MARKET
- Average Sales Price has increased to $794,000 (continues to increase)
- Average Discount remains at 6%
- Sweet spot in sales are homes priced between $400,000 – $900,000 and between $1M-$1.5M
- 26.9% of all deals are CASH
- 78.8% of buyers are primary residents
- Buyers are not just local and from other US cities, but also from Argentina, France, Italy and Colombia.
DOWNLOAD MIAMISM 3D MARKET ANALYZER REPORT


