Surfside Real Estate Market Report – September 2017
Surfside Real Estate Market Report – September 2017
There are currently 46 Surfside homes for sale: (compared to 48 in August)
-
Highest priced listing: $5,000,000 (1332 Biscaya Dr – see below)
-
Lowest priced listing: $550,000 (8835 Abbott Ave – see below)
-
Pending Sales: 3 (same as in August)
-
Closed Sales in September: 5 (compared to 1 in August)
-
Median Sales Price in September: $659,324
The 5 Surfside homes sold in September were the following:
- 1028 88th St – waterfront home with 5 bedrooms / 4 bathrooms, 3,883 SF of living space, 10,000 SF lot with 50′ of water frontage. Originally listed for $2,595,000 in April and selling for $2,210,000 ($611/SF)
- 8875 Emerson Avenue – 3 bedrooms / 2.5 bathrooms, 2,281 SF of living space, 6,860 SF lot. Originally listed for $729,900 in February and sold for $620,000 ($323/SF)
- 8911 Carlyle Ave – 4 bedrooms / 2 bathrooms, 2,207 SF of living space, 5,600 SF lot. Originally listed for $759,000 in January and sold for $659,324 ($299/SF)
- 9156 Harding Ave – 3 bedrooms / 2 bathrooms, 1,700 SF of living space on 5,600 SF lot. Listed for $559,000 in August and sold for $525,000 ($309/SF) **It has been listed again for $750,000
- 9049 Froude Ave – 3 bedrooms / 2 bathrooms, 1,835 SF of living space on 5,600 SF lot. Originally listed for $550,000 with several contracts that fell through and finally closing for $530,000 ($364/SF)
The average selling price per square foot for Surfside homes not on the water in September was $324 compared to previous months:
- $420/SF in August
- $378/SF in July
- $398/SF in June
- $355/SF in May
- $387/SF in April
- $423/SF in March
- $423/SF in February
- $363/SF in January
- 2016’s average of $377/SF.
There was one waterfront home sold in September, listed above, selling at $611/SF. There have been only 6 waterfront homes sold in Surfside in 2017 to date – the average price per square foot for all 6 is $596.

The drop in average price per square foot in September is due to the condition of the homes sold last month. When most homes are fixer uppers, the average will reflect just that. Remember that going back 6 months and even one year, is a healthier way to gauge what prices are doing.
With that said, the market is shifting to a buyer’s market and this is evident with our REAL-TIME MARKET ACTION INDEX, which indicates that by measuring the current rate of sale versus the amount of the inventory, an index above 30 implies Seller’s Market conditions and below 30, conditions that favor the buyer. Surfside Market Action Index has increased to 25 compared to 21 last month, which shows the market moving into the Seller’s zone and we are likely to see upward pressure on pricing.
Contact us for a no-obligation consultation to give you an idea what your home could sell for or go to MiamismVALUE.com to make your request.
Surfside Home of The Month
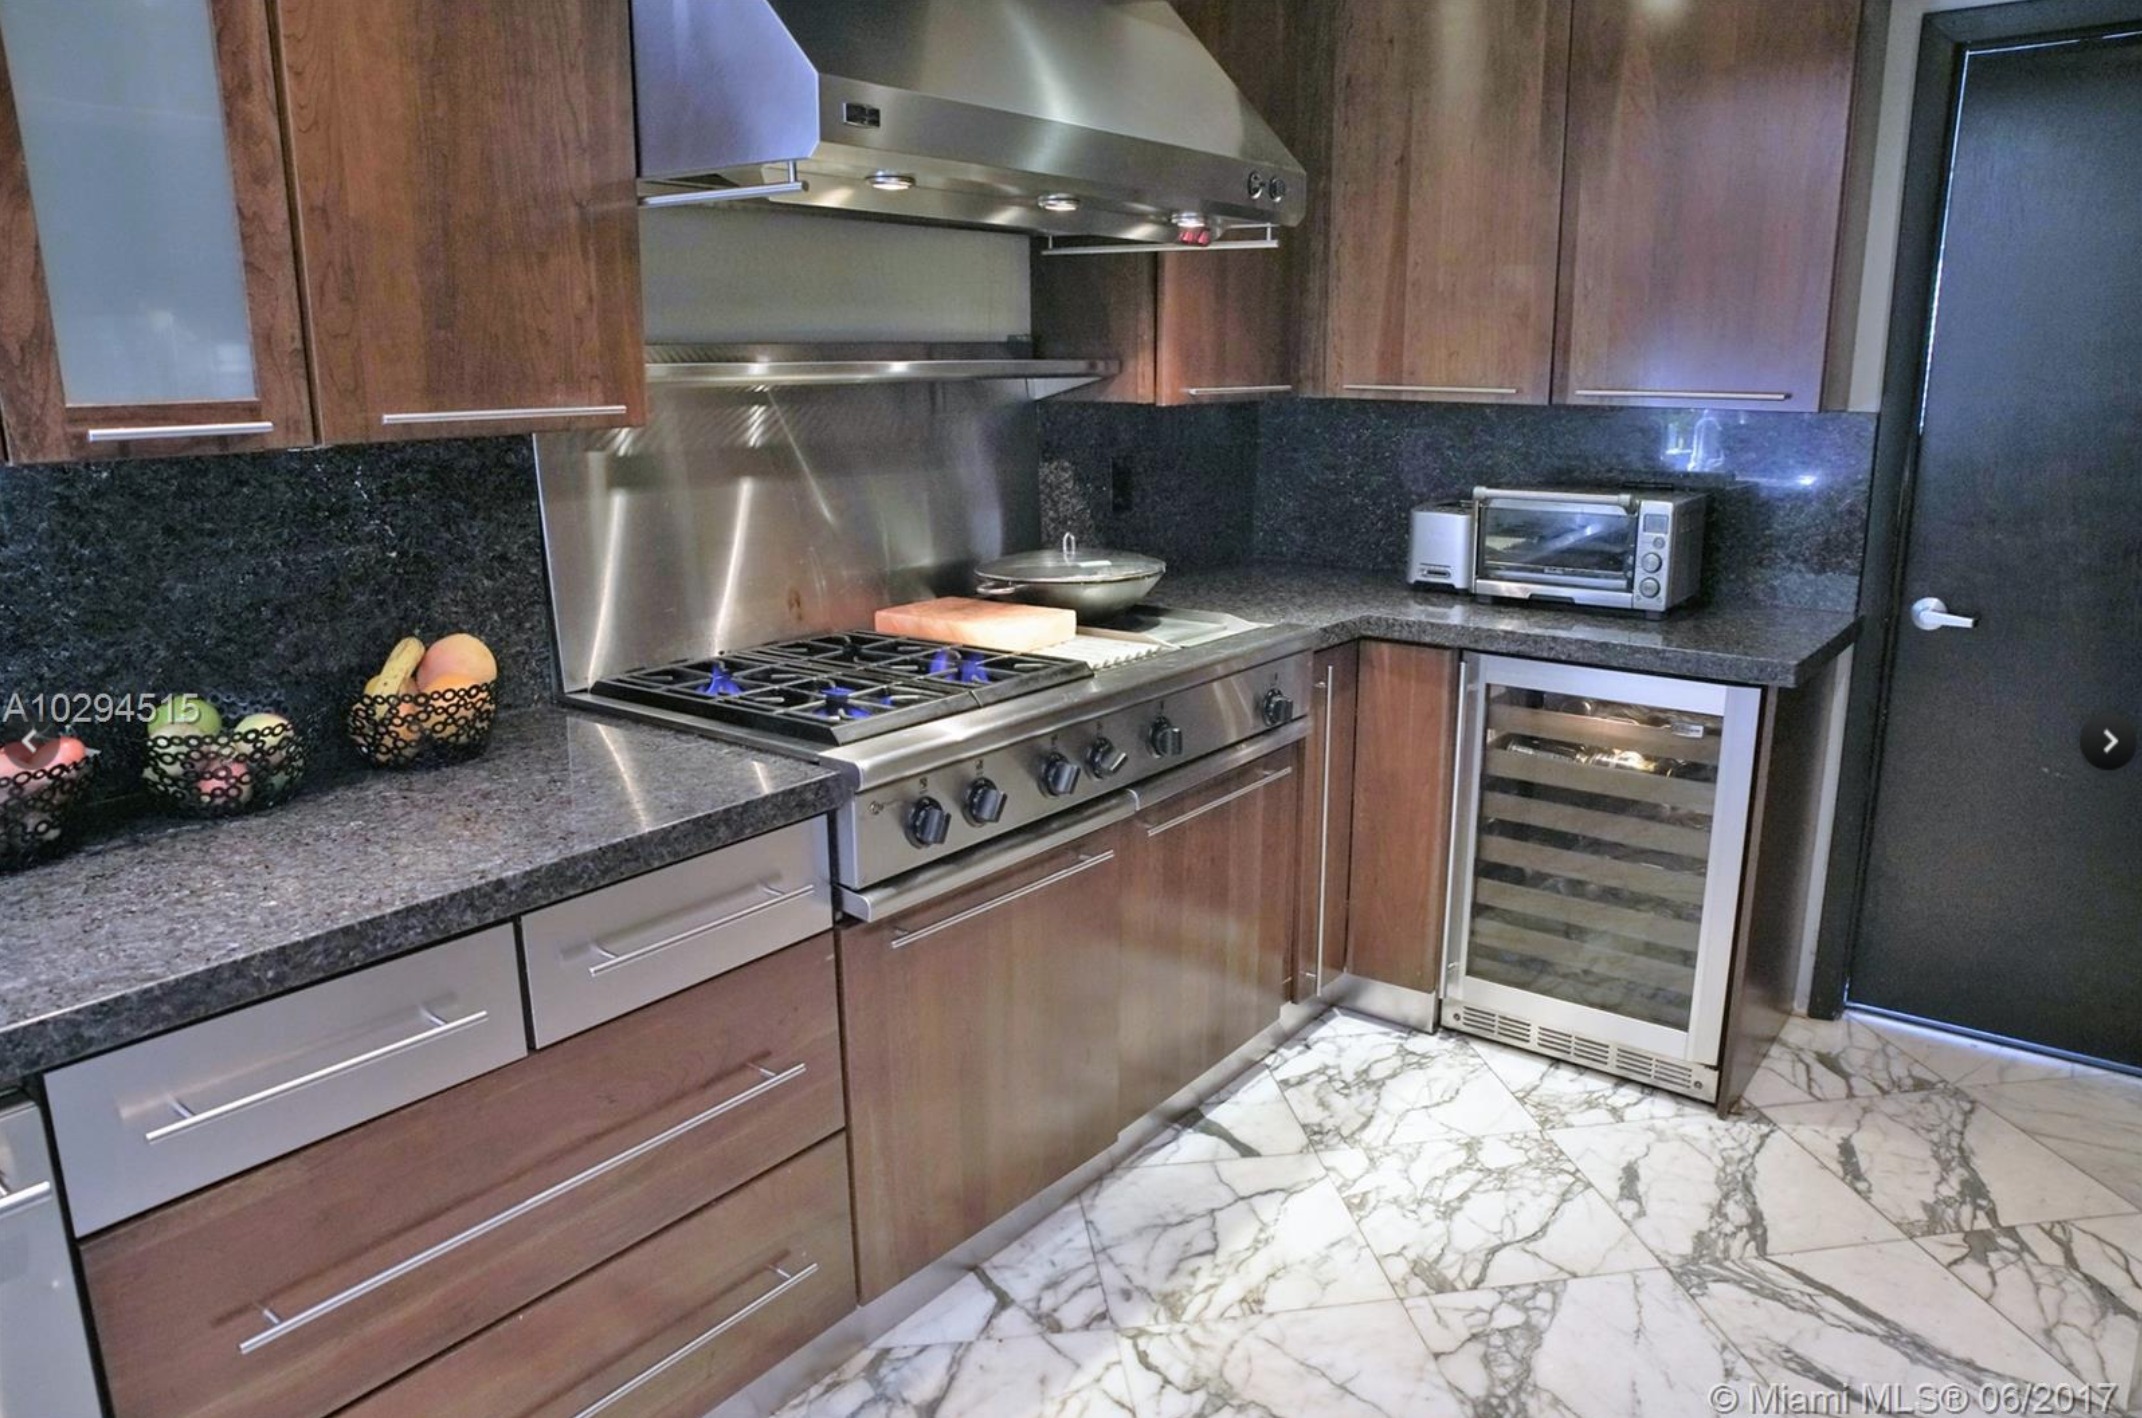
This month, The Miamism Sales Team recommends the waterfront home located at 400 91 Street. We’re talking a rare and charming 1935 home with delicate attention to details: Brazilian IPE wood floors, 8′ privacy hedge, gourmet kitchen with gas and GE Monogram appliances. It’s not often we see a home with charm for sale in Surfside, this one is breathtaking from the moment you set your eyes on the ivy that covers its facade.
The home has 4 bedrooms, 3 bathrooms, 2,668 SF of living space and sits on a 5,625 SF lot.
It’s offered for $895,000 ($335/SF)
Please contact us for additional information or to schedule a showing appointment for this and any other Surfside home. Details and photos right below this post.
