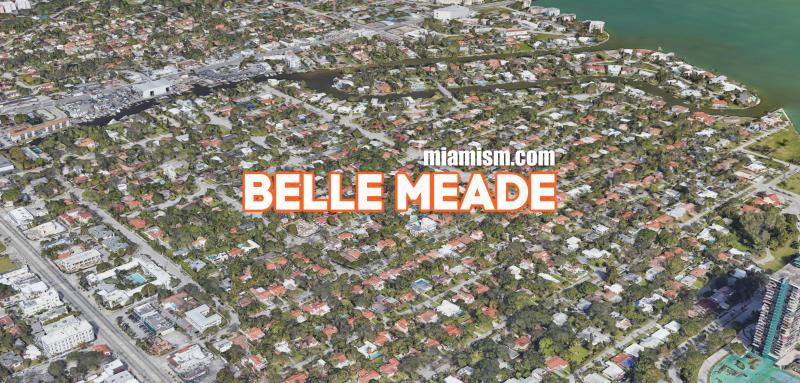
Belle Meade Real Estate – Jan 2022 – monthly market report
Welcome to our Belle Meade Real Estate monthly market report – we publish these the last week of the month, so come back to see how the market is doing and how it compares to the past year.
How is the Belle Meade Real Estate Market Doing?
There are currently 7 homes for sale in Belle Meade (compared to 5 same month last year):
- Highest priced listing $19.5 Million for the huge open bay property with 480′ of water frontage and 29,452 Sq.Ft. of land which includes 7301 and 7305 Belle Meade Island Dr (this property has been listed since December of 2020)
- Lowest priced listing is $1,300,000 for the property at 763 NE 74th St – a 3 bedroom / 2 bathroom home with 1,719 Sq.Ft of living space, on a 7,80 Sq.Ft. lot.
- Pending Sales (Properties under contract): 4
- Median Sales Price in January: $2,322,500 (Compared to $3.3 Million in January of 2021)
- Closed sales in January 2022: 2 (compared to 4 in January of 2021)
What is the average price per square foot in Belle Meade?
Belle Meade Waterfront Sales
The average sold price per square foot in Belle Meade waterfront homes in January was $718 with only one sale, compared to $790 one year ago (Jan 2021), and:
Belle Meade Non-Waterfront Sales (Dry Lots)
The average sold price per square foot in Belle Meade for homes not on the water in January was $477 with only one sale, compared to $471 one year ago (Jan 2021), and:
Belle Meade Real Estate Micro-Stats
Feel free to download our complete market report for the last 12 months, showing micro-stats for Real Estate Belle Meade.

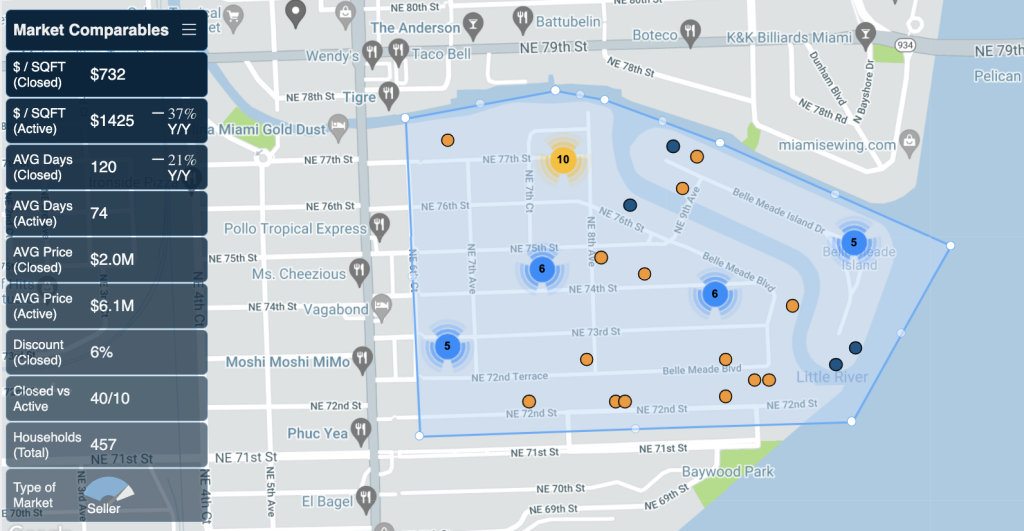
- Seller’s market with only 3 months of inventory.
- Average Sales Price is $2 Million
- Average Discount is 6%
- 2 Sweet spots in sales: homes between $1-$1.5 Million and homes above $2 Million.
- 30.4% of all deals are CASH
- 80% of buyers are primary residents
DOWNLOAD BELLE MEADE 3D MARKET REPORT
