How is The Belle Meade Real Estate Market Doing?
There are currently 24 single-family homes for sale: (compared to 21 last month)
- Highest priced listing is
$7,850,000$7,495,000 for the bay front, new construction home at 7311 Belle Meade Island Dr. - Lowest priced listing is
$499,900$479,900 for the 2/2 foreclosure at 810 NE 75 St - Pending Sales (Properties under contract): 7
- Median Sales Price in October: $1,912,500
- Closed sales in October: 2 (compared to 3 in September)
There 2 Belle Meade homes sold in October were the following:
- 744 NE 73 St – 1938 beauty with in-law quarters with total 4 bedrooms / 3 bathrooms, 2,071 SF on 8,850 SF lot. Listed in August for $775,000 and selling for full-price ($380/SF)
- 928 Belle Meade Island Dr – waterfront with 3 bedrooms / 2.5 bathrooms, 3,492 SF on 14,850 SF lot with . 90′ of water frontage. Originally listed for $2,650,000 in January of 2018, increased to $2,690,000 in May of 2019, with 2 price decreases and selling for $2,275,000 ($651/SF) **cash transaction
Average price per square foot for Belle Meade homes not on the water in October was $380 (only one sale), compared to previous months:
- September’s average $454
- August’s average $298 (one sale)
- July’s average $328
- June’s average –no sales
- May’s average $365
- April’s average $399
- March’s average $369 (one sale)
- February’s average $374
- January’s average $294 (one sale)
- 2018’s average (not on the water) $356
There was one waterfront home sold in Belle Meade in October, selling for $651/SF. The price per square foot for homes on the water in previous months was:
- September’s average $673 (one sale)
- August’s average $306 (one sale) **unbuilt land with plans
- July’s average $687 (one sale)
- June’s average – no sales
- May’s average – $796 (one sale)
- April’s average – no sales
- March’s average – no sales
- February’s average $414 (one sale)
- January’s average – no sales
- 2018’s average (waterfront) $683
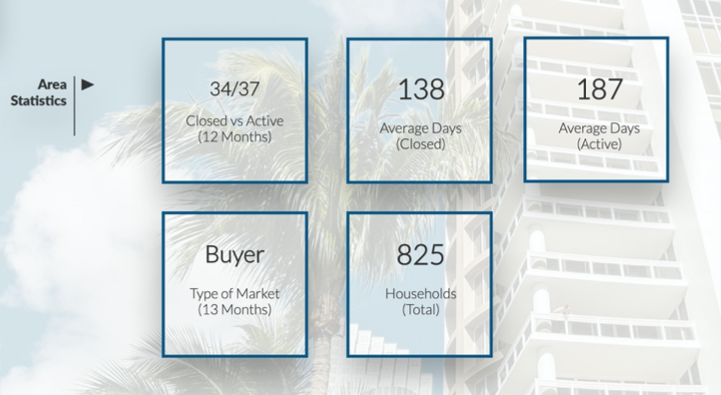
There are 13 months of inventory in Belle Meade at the moment and only 23.5% of the market is investors.
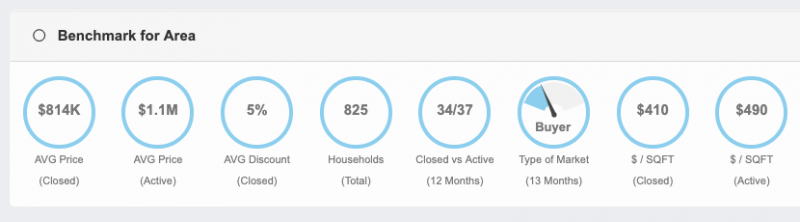
The Market Action Index for 33138 remains at 27 and showing a slight buyer’s advantage.
Our new market reports are available to you upon request or once a month if you request to be added to our mailing list. (We don’t spam and only send relevant content you request).
We are now providing micro-data for our clients which really go granular and help you make an educated decision about buying or selling and for how much. This data not only gives you negotiating power based on historical data in the different areas, but help you really understand the differences in homes depending on bedrooms, size, year built and so much more. An example of this is 3-bedroom homes selling at an average of $424/SF compared to $389/SF for 4-bedroom homes. Most sales in Belle Meade are home built before 1947 and the price range that moves the most is between $500,000 and $699,000.
For a free copy of this report, click HERE.
And finally, for a no-obligation home value report, visit MiamismValue.com or contact us for a consultation.