Keystone Point Real Estate Market Report for 2016
We create real estate market reports to empower you to make educated decisions about buying and selling real estate in Miami. The premise is simple, the better educated you are about the real estate market, the better equipped you will be to make decisions about pricing and market timing. In addition to these reports, which contain our opinion, we also offer REAL-TIME reports that will give you precise and specific, up-to-the-minute stats.
Remember we are just an email or telephone call away, if you ever want more information, feel free to shoot us a line info@miamism.com or use the contact forms all over our website.
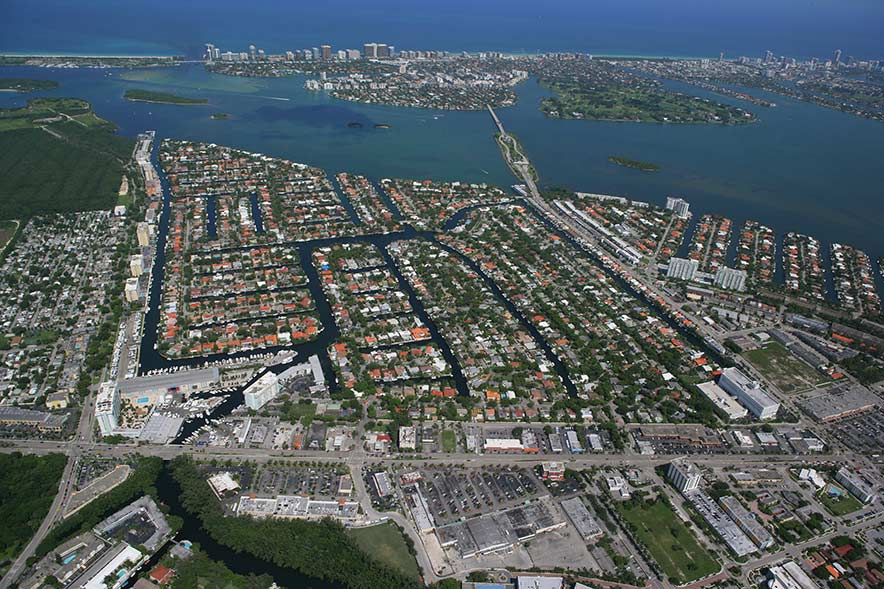
Keystone Point is still a buyer’s market – there’s more demand than supply but prices are not increasing, they are staying stable. It still remains one of the least expensive waterfront areas in Miami, so the demand is strong. In addition to the demand, the community continues to improve and it is rare to find ugly homes in need of repairs. Having pretty neighbors always helps everyone’s return!
There were 38 Keystone Point homes sold in 2016 and 27 of them were waterfront. Wait until you read what has happened to average price per square foot.
Keystone Point Waterfront Homes – Price per Square Foot
Take a look at the changes in average price per square foot for homes on the water in Keystone Point:
| Year | Price per SF |
|---|---|
| 2016 | $432/SF |
| 2015 | $441/SF |
| 2014 | $395/SF |
| 2013 | $328/SF |
Although we see a decrease from 2015 to 2016, don’t interpret this to mean that prices are going down, it just means that the mega sales we had seen in 2015, were not present in 2016. As always, the stately homes with direct baby views sell for a premium and when there are not many sales of large magnitude, it affects the the average. Keystone point waterfront homes continue to appreciate but in this case, conservatively.
Keystone Point Dry-Lot Homes – Price per Square Foot
Take a look at the changes in average price per square foot for homes NOT on the water in Keystone Point:
| Year | Price per SF |
|---|---|
| 2016 | $287/SF |
| 2015 | $273/SF |
| 2014 | $230/SF |
| 2013 | $190/SF |
There continues to be a conservative increase in price per square foot of homes not on the water in Keystone Point. Although there were only 11 sales in 2016, you can see the clear appreciation.
Keystone Point Real Estate Market Report for 2016

The general figures for Keystone Point homes in 2016 are the following: (click HERE to see stats from 2015)
- There were 38 Keystone Point homes sold in 2016. The median sales price was $975,000 compared to $877,500 in 2015, $860,000 in 2014 and $685,000 in 2013.
- The highest sale in Keystone Point in 2016 was for the bay front estate located at 13005 Biscayne Bay Dr. This was a 5 bedroom / 7 bathroom home with 150′ of open bay water frontage, 22,500 SF lot, built in 1977 with amazing tropical setting. The home was originally listed in 2013 for $4.95 Million, showing a pending sale that fell through, some price adjustments, and finally selling for $4,265,625 in January of 2016.
- The lowest Keystone Point home sold in 2016 was a short sale at 12620 Ixora Rd. This 2 bedroom / 2 bathroom home was listed for $230,000 in March of 2014 – showing a pending contract since September of 2015 and closing for $250,000 in March of 2016.
- Out of the 38 homes sold in Keystone in 2016, one was a short sale and 3 were foreclosures. Please note that our of the 62 homes currently listed for sale, there is only one distressed sale (Foreclosure at 12630 Ixora Rd for $469,040)
- The highest sale for a dry-lot home (non-waterfront) in Keystone Point was $1,067,244 for a bank owned home at 12943 Ixora Circle, built in 1955 with 3,137 SF of living area on a 10,875 SF lot.
- The average price per square foot in Keystone Point coming in at $390, compared to $380 in 2016 and $349 in 2014.
List of Keystone Point Homes Sold in 2016
To get a list of all Keystone Point homes sold in 2016, please contact us.
