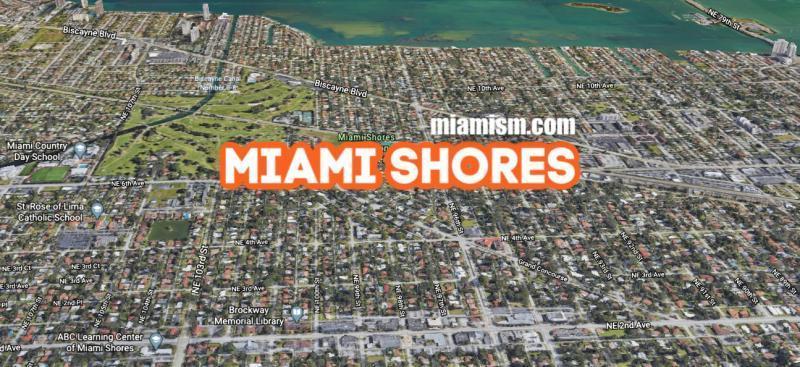
How is the Miami Shores Real Estate Market Doing?
There are currently 22 homes for sale: (compared to 45 in February)
- Highest priced listing $3,995,000 for the property under construction at 1276 NE 93 St, with water view of The Miami Shores Boardwalk. 5 bedrooms / 4 bathrooms/ 2 half-baths ($950/SF)
- Lowest priced listing is $655,000 for the 3/2 at 140 NW 102 St ($367/SF)
- Pending Sales (Properties under contract): 68
- Median Sales Price in March: $787,000
- Closed sales in March: 22
DOWNLOAD MIAMISM 3D MARKET ANALYZER REPORT
What sold in Miami Shores last month?
For a list of all Miami Shores homes sold in March please email us at MiamiShores@miamism.com
DOWNLOAD MIAMISM 3D MARKET ANALYZER REPORT
What is the average price per square foot in Miami Shores?
The average sold price per square foot in Miami Shores in March for homes not on the water was $421, compared to:
- February’s average $368
- January’s average $332
- 2020’s average of $338
- 2019’s average of $324.
There was 1 waterfront home sold in Miami Shores in March selling at $321/SF, compared to:
- February’s average – $550 (1 sale – fixed bridge)
- January’s average – no waterfront sales
DOWNLOAD MIAMISM 3D MARKET ANALYZER REPORT
Top 3 Sales in Miami Shores in March (by square footage)
- One of a kind architectural beauty on 23,000 SF lot, built in 2021 with 5 bedrooms / 5.5 bathrooms and over 4,000 SF of living space. Listed for $3.350 in August of 2020 and selling for $3,250,000 ($807/SF)
- Beautiful golf course home at 667 NE 105th St with 3 bedrooms / 3.5 bathrooms and 2,356 SF on 14,600 SF lot. Purchased for $870,000 in September of 2019, re-listed for $1,599,000 in December 2020 and selling for $1,400,000 ($670/SF) **cash transaction
- Beautiful 1924 home at 485 NE 94th St with 4 bedrooms / 3 bathrooms and 3,364 SF on 19,964 SF lot. Listed for $1,748,000 in October 2020 and selling for $1,610,000 ($562/SF)
DOWNLOAD MIAMISM 3D MARKET ANALYZER REPORT
Miami Shores Opinion
We provide a comprehensive 3D market report with in-depth data from the last 12 months that you can download HERE.

Some key points you should know:
- Decreased inventory and more demand with only 1 month of inventory and aggressive SELLER’s MARKET
- Average Sales Price has increased to $716,000
- Average Discount is 6%
- Sweet spot in sales are homes priced between $400,000 – $1.5 M
- 24.6% of all deals are CASH
- 76.9% of buyers are primary residents
- Buyers are coming from U.S., Argentina, Brazil, Colombia and Spain
DOWNLOAD MIAMISM 3D MARKET ANALYZER REPORT
We have buyers actively looking in Miami Shores right now. If you are considering selling your home, please contact us ASAP!
Market Reports for The Tri-villages

