
Surfside Real Estate Market Report – September 2019
How is the Surfside Real Estate Market Doing?
There are currently 48 Surfside homes for sale:
-
Highest priced listing: $5,250,000 for the waterfront home at Biscaya Island, located at 1413 Biscaya Dr with 6 bedrooms / 6.5 bathrooms, 6,072 SF on 10,709 SF lot with 68′ of water frontage.
-
Lowest priced listing: $550,000 for the small, 2/1 home, being sold as development opportunity with 2 adjacent lots also available for sale.
-
Pending Sales: 6
-
Closed Sales in September: 2
-
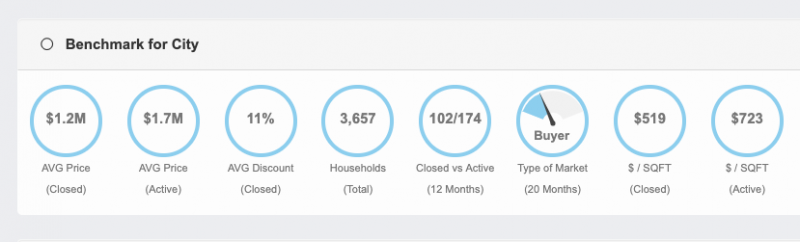
Median Sales Price in September: $803,500
The 2 Surfside homes sold in September were the following:
- 9409 Bay Dr – remodeled 3 bedrooms / 2 bathrooms with 1,740 SF on 5,600 SF lot. Listed for $697,000 in June and selling for $662,000 ($418/SF) **cash transaction
- 9217 Bay Dr – remodeled 3 bedrooms / 3.5 bathrooms with 2,112 SF on 8,250 SF lot. This home sold for $885,000 in March of 2018, was relisted in July of 2019 for $1,115,000, reduced to $950k and sold for $945,000 ($447/SF)
The average price per square foot in September for Surfside homes not on the water was $433, compared to previous months:
- August average $385
- July’s average $380
- June’s average $391
- May’s average $446
- April’s average $337
- March’s average $410
- February’s average $352 (1 sale)
- January’s average **no sales
- 2018’s average $360
There were no waterfront sales in the month of September in Surfside and therefore, no average. The average price per square foot in previous months was:
- August average **no sales
- July’s average **no sales
- June’s average **no sales
- May’s average $852 (one sale)
- April’s average $756 (one sale)
- March’s average **no sales
- February’s average $598
- January’s average $690
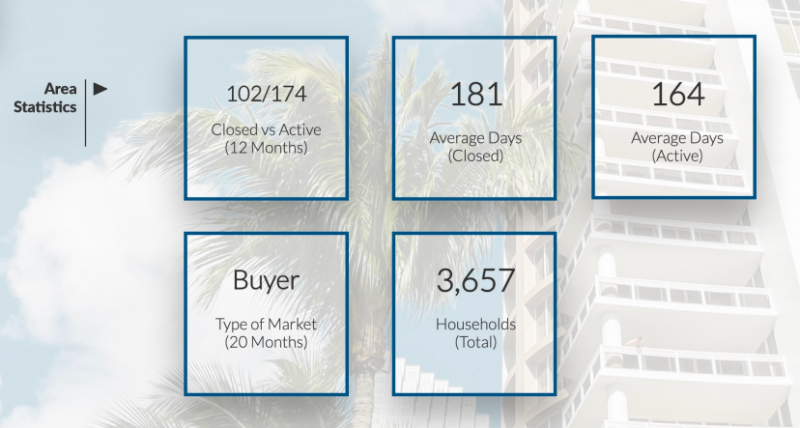
Surfside continues to be a buyer’s market with 20 months of inventory. The inventory that is moving quickly are updated homes priced accordingly. The overpriced inventory is sitting still and possibly getting stagnant, hence the reason for pricing right and not “testing the market” when buyers have the upper hand.
With our new market reports we are able to go super granular into the data and analyze what factors contribute to your home selling faster and for more money. Did you know that mid-century homes make up the most sales in Surfside? We could argue that there is a lot more inventory built between 1950-1969, but did you know that the average price per square foot for those homes is $430, compared to $353/SF for 70’s homes and $379/SF for 80’s properties!
Our new reports, which you can DOWNLOAD HERE, use the last 12 months of data, for you to make an educated decision about buying or selling depending on robust data.
The Micro data we produce will educate you on real estate market conditions and will empower you into making the right move.
The Market Action Index has decreased to 24, which still shows slight buyer’s advantage.
Slight Buyer’s Advantage
The Market Action Index has been trending lower for several weeks while prices have remained relatively stable. If inventory continues to grow relative to demand however, it is likely that we will see downward pressure on pricing.
Please contact us when you are ready to buy and sell in Surfside – click here for a complimentary evaluation of your home