We create real estate market reports to empower you to make educated decisions about buying and selling real estate in Miami. The premise is simple, the better educated you are about the real estate market, the better equipped you will be to make decisions about pricing and market timing. In addition to these reports, which contain our opinion, we also offer REAL-TIME reports that will give you precise and specific, up-to-the-minute stats.
Remember we are just an email or telephone call away, if you ever want more information, feel free to shoot us a line info@miamism.com or use the contact forms all over our website.
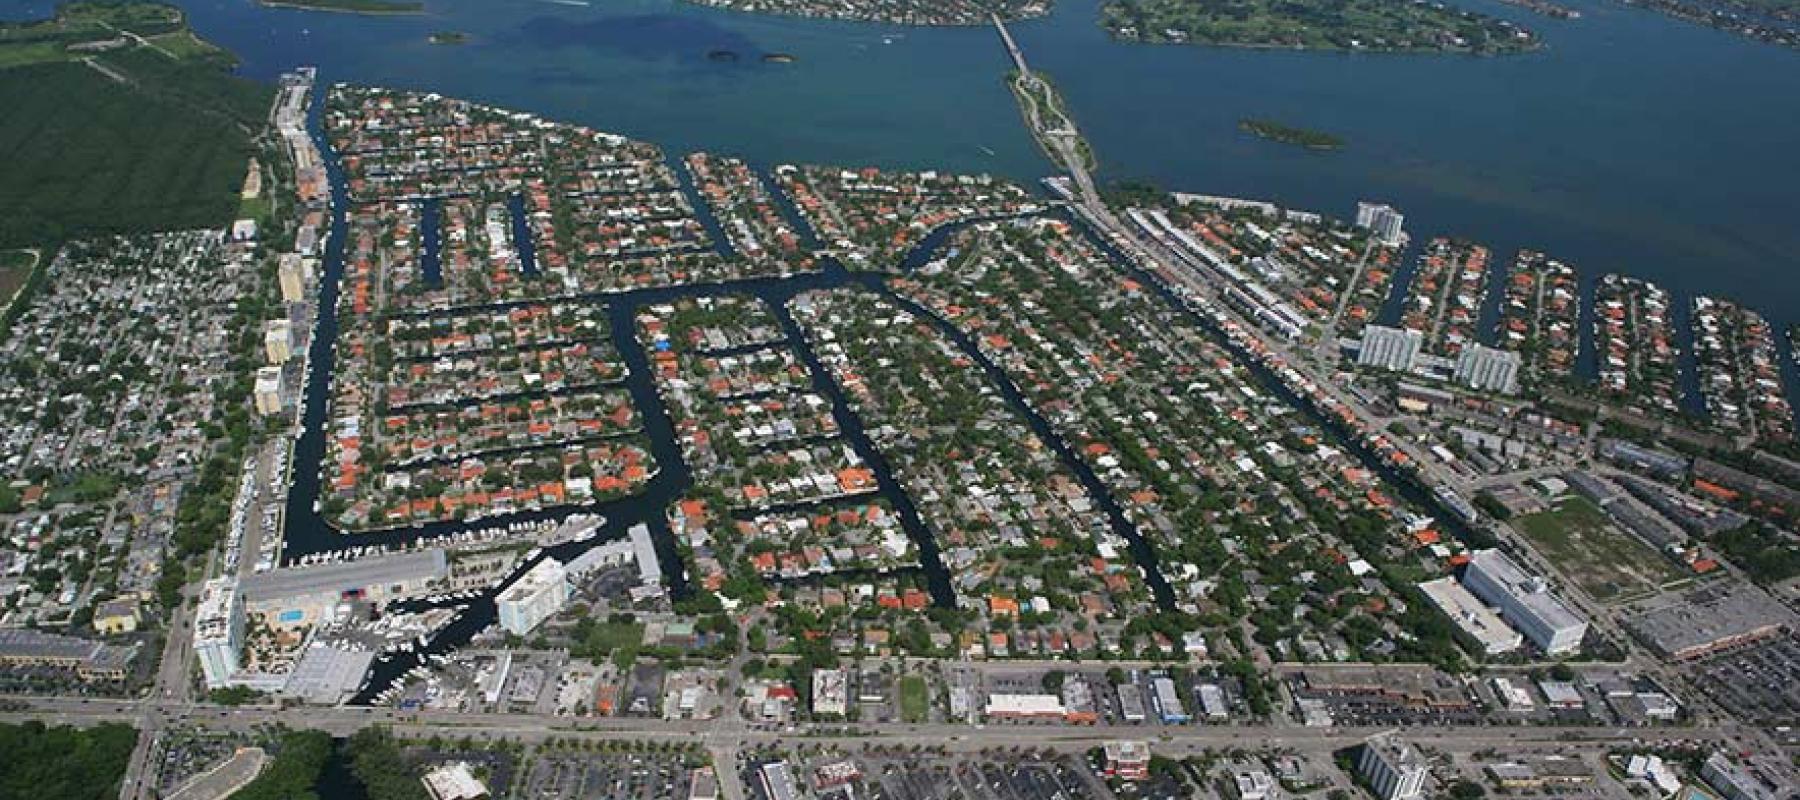
Keystone Point is still a buyer’s market – home sales have been exceeding new inventory for several weeks. Since this is a Buyer’s market, prices are not yet moving higher as excess inventory is consumed. But prices have remained stable and as supply and demand trends continue, the market will move into the Seller’s zone and we are likely to see upward pressure on pricing.
We are also seeing an incredible change in the community with evident pride of ownership and new construction. This is always positive for the community and pricing.
There were 51 Keystone Point homes sold in 2017 and 36 of them were waterfront. Next will give you different stats, including changes in average price per square foot.
Keystone Point Waterfront Homes – Price per Square Foot
Take a look at the changes in average price per square foot for homes on the water in Keystone Point:
| Year | Price per SF |
|---|---|
| 2017 | $421/SF |
| 2016 | $432/SF |
| 2015 | $441/SF |
| 2014 | $395/SF |
| 2013 | $328/SF |
There’s an evident decrease from 2015 to 2017 and this is a reflection of the uber luxury market taking a big hit last year. All of Miami is seeing the real estate market above $2.5 Million, getting hit hard with fewer sales and more inventory. Out of the 36 waterfront homes sold in Keystone in 2017, only 6 were above $500/SF.
There were also a lot of sales under the $400/SF range, reflecting fixer upper inventory on the island. This means that people are looking for fixer upper deals to make their own. Keystone Point is in a market of its own with 44% of all waterfront sales happening under the $400/SF range.
Out of the 27 waterfront homes currently for sale in Keystone Point right now, only 1 is listed under $400/SF. It will be interesting to see how long it takes to absorb the current inventory.
Keystone Point Dry-Lot Homes – Price per Square Foot
Take a look at the changes in average price per square foot for homes NOT on the water in Keystone Point:
| Year | Price per SF |
|---|---|
| 2017 | $285/SF |
| 2016 | $287/SF |
| 2015 | $273/SF |
| 2014 | $230/SF |
| 2013 | $190/SF |
Not only did we see a decrease in waterfront homes in Keystone in 2017, but homes not on the water also suffered a slight decrease. This decrease is only $2/SF which is minimal for annual stats – it actually shows a stable market.
Keystone Point Real Estate Market Report for 2017
The general figures for Keystone Point homes in 2017 are the following: (click HERE to see stats from 2016)
- There were 51 Keystone Point homes sold in 2017. The median sales price was $887,500, compared to $975,000 in 2016 and $877,500 in 2015.
- The highest sale in Keystone Point in 2017 was for the bay front estate located at 13205 Biscayne Bay Dr. This was a 6 bedrooms / 5.5 bathroom home with 100′ of open bay water frontage, 15,270 SF lot, built in 1976. The home was originally listed in 2015 for $4.65 Million, reduced to $4.45 Million in 2016 and sold for $3,537,500 in March of 2017.
- The lowest Keystone Point home sold in 2017 was located at 1845 Alamanda Dr. This 3 bedroom / 2 bathroom home was listed for $700,000 in March of 2016 – showing 2 pending contracts with last one finally closing at $390,000.
- Out of the 51 homes sold in Keystone in 2017, 3 were short sales and 1 was a foreclosure. Please note that out of the 41 homes currently listed for sale, there is only 1 distressed property (Foreclosure at 12630 Ixora Rd for $469,040).
- The highest sale for a dry-lot home (non-waterfront) in Keystone Point was $887,500 for the home at 2135 Alamanda Dr, built in 1954 with 2,909 SF of living area on a 22,078 SF lot.
- The average price per square foot in Keystone Point coming in at $381, compared to $390 in 2016, $380 in 2015 and $349 in 2014.
List of Keystone Point Homes Sold in 2017
To get a list of all Keystone Point homes sold in 2017, please contact us.