Keystone Point Real Estate Market Report for 2018
2018 proved to be challenging for several neighborhoods around Miami, including Keystone Point. Remember we provide these market reports on a monthly basis to help you stay informed about the value of your home and fluctuations in our local market. We work hard to provide these stats and hope you consider us when you are ready to sell your property. We can even provide a personalized home value analysis at any time, without obligation. You would be surprised how many times we tell our clients to hold on to their property a bit longer in order to make a better return.
With that said, we also offer REAL-TIME reports that will give you precise and specific, up-to-the-minute stats.
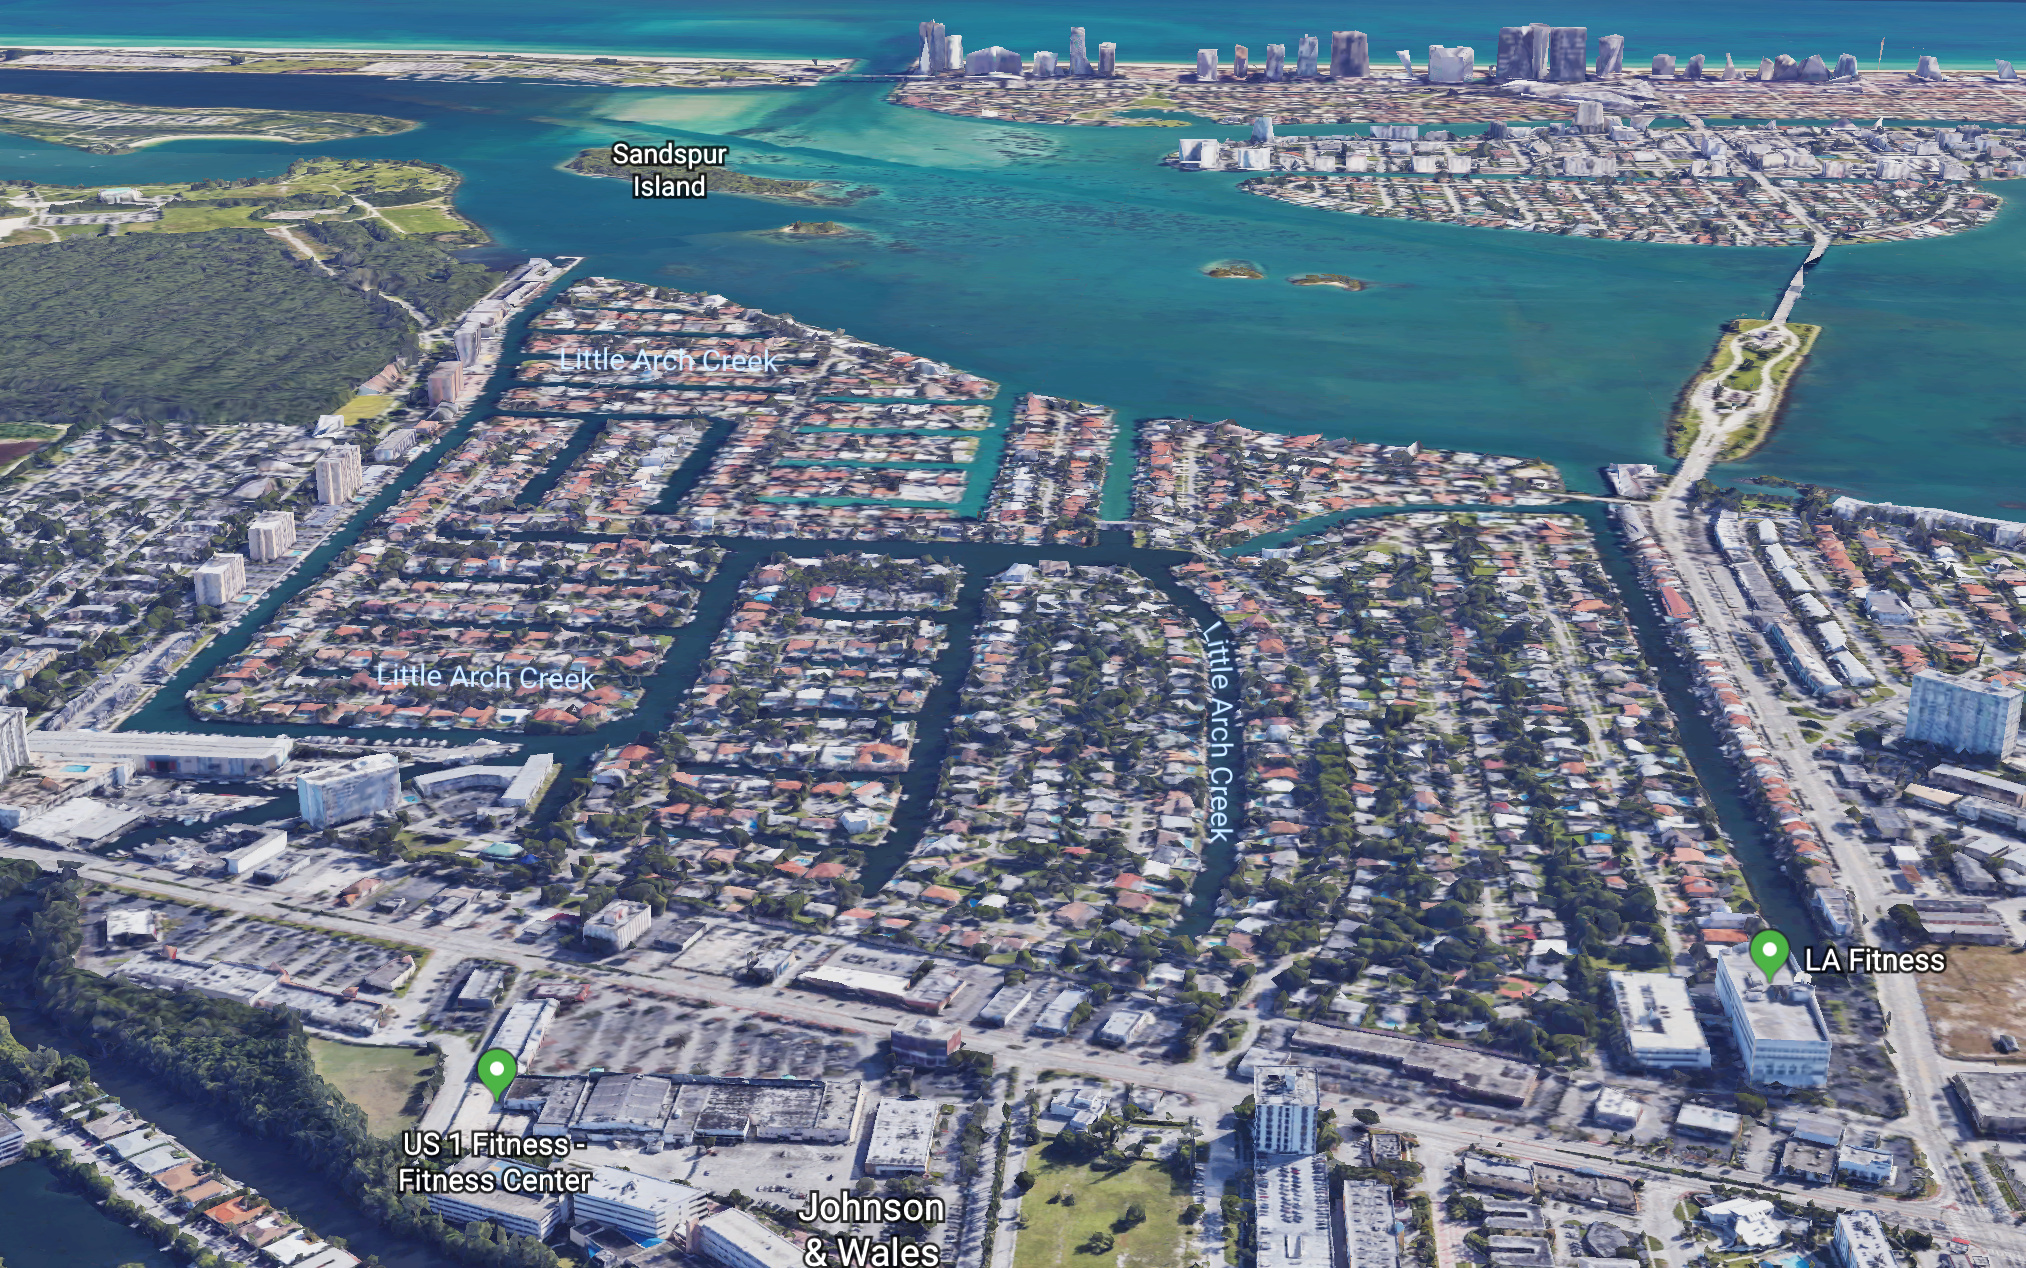
Keystone Point continues to be a buyer’s market and has shown evidence of slowing down. Both prices and inventory level have remained unchanged. Although we are seeing quite a bit of new construction, these new homes are not moving as quickly as we had hoped. This is common in a correcting market but don’t misconstrue this as a market collapse, on the contrary, even with a stabilizing market, there’s an obvious increase in average price per square from the same time last year. Keystone Point continues to be one of the most affordable waterfront communities in Miami.
There were 41 Keystone Point homes sold in 2018, and 34 of them were waterfront. Next will give you different stats, including changes in average price per square foot.
Keystone Point Waterfront Homes – Price per Square Foot
Take a look at the changes in average price per square foot for homes on the water in Keystone Point:
| Year | Price per SF |
|---|---|
| 2018 | $476/SF |
| 2017 | $421/SF |
| 2016 | $432/SF |
| 2015 | $441/SF |
| 2014 | $395/SF |
| 2013 | $328/SF |
While the rest of Miami is showing decreases in pricing, Keystone Point saw a nice increase from 2017 to 2018. The uber luxury market above $2.5 Million is moving slower than the rest of the inventory. Out of the 41 waterfront homes sold in Keystone in 2018, 13 were over $500/SF (That’s 32% of total sales).
In 2017, 44% of all waterfront sales were under $400/SF – In 2018, only 3% were under $400/SF. This means the type of inventory that is moving, is at a higher price, making Keystone Point a really favorable market.
The lowest priced waterfront home in Keystone right now is priced at $839,900 and it’s a complete fixer-upper.
Keystone Point Dry-Lot Homes – Price per Square Foot
Take a look at the changes in average price per square foot for homes NOT on the water in Keystone Point:
| Year | Price per SF |
|---|---|
| 2018 | $303/SF |
| 2017 | $285/SF |
| 2016 | $287/SF |
| 2015 | $273/SF |
| 2014 | $230/SF |
| 2013 | $190/SF |
27% of Keystone’s total for sale inventory is for non-waterfront homes. There were only 7 non-waterfront sales in 2018 with the highest sale coming in at $725,000 and lowest at $425,000.
The lowest priced home currently listed in Keystone is priced at $469,040, it’s an Auction property sold “as-is” without any guarantee or warranty by seller and it’s not waterfront.
Keystone Point Real Estate Market Report for 2018

The general figures for Keystone Point homes in 2018 are the following: (click HERE to see stats from 2017)
- There were 41 Keystone Point homes sold in 2018. The median sales price was $1,175,000, compared to $887,500 in 2017, $975,000 in 2016 and $877,500 in 2015.
- The highest sale in Keystone Point in 2018 was for the bay front estate located at 12485 Keystone Island Dr. This was a 5 bedrooms/ 5.5 bathroom home with 7,550 SF of living space, on 15,393 SF lot with over 100′ of direct bay frontage. The home was originally listed for $5.29 Million and sold for $4,427,500 in March of 2018.
- The lowest Keystone Point home sold in 2018 was located at 1905 Alamanda Dr. This 2 bedroom / 2 bathroom home was not on the water and listed for $525,000 in July of 2017, sold for $425,000 in June of 2018 and is currently back on the market for $495,000.
- None of the 41 homes sold in 2018 were distressed sales, meaning no short sales or foreclosures. This is a clear sign of a strong real estate market.
- The highest sale for a dry-lot home in Keystone Point was $725,000 for the home at 2075 S Hibiscus Dr, a 3 bedroom / 3 bathroom home, beautifully updated. Selling for $362/SF.
- The average price per square foot in Keystone Point coming in at $447, compared to $381 in 2017, $390 in 2016, $380 in 2015 and $349 in 2014.
List of Keystone Point Homes Sold in 2018
To get a list of all Keystone Point homes sold in 2018, please contact us.
