Keystone Point Real Estate Market Report
There are currently 39 Keystone Point homes for sale: (compared to 40 in July)
- Highest priced listing: $6,300,000 (for the new construction with 240′ of water frontage at 12395 Keystone Island Dr)**see info below
- Lowest priced listing: $465,000 for the single-family vacant lot (not on the water) with 12,000 SF located at 1857 NE 124 St
- Pending Sales (properties under contract): 2
- Closed sales in August: 1 (compared to 3 in July)
- Median Sales Price in June: $1.4 Million
The Keystone Point home that sold in August was the home at 12905 Ixora Road. This 3 bedroom / 3 bathroom home was completely gutted and rebuilt in 2007, sitting in an oversized lot with 12,300 SF and 230’ of water frontage as well as 3,391 SF of living space. It was listed for $1.495 Million in June and sold for $1.4 Million ($413/SF)
Keystone Point Price per Square Foot
The average price per square foot for Keystone Point Homes on the water in August was $413 compared to previous months:
- July average $432
- June average $388
- May average $388
- April average $372
- March average $475
- February average $428
- January average $462
- 2016’s average of $432.
The average price per square foot analysis doesn’t’t quite work when there is one or 2 sales. It’s obvious that going back 6 months makes a lot more sense. July and August sales show just that but gives you an idea what homes in move-in condition are selling for. The average price per square foot in Keystone Point in the first 8 months of 2017 (waterfront homes), was $432.
It’s important to differentiate between low sales and a decreasing market. There have been many factors affecting the real estate market: political tension, changes in foreign currencies, extreme weather…etc. With that said, the amount of sales has dropped, but not pricing. Inventory continues to be low and prices continue to increase in many areas. In the case of Keystone Point, price per square foot has remained constant. Notice that the average for 2016 and the first 8 months of 2017 are identical. We may see a slight drop in prices, but never if the property is in top-notch condition.
If you look at our REAL-MARKET REPORTS for the 33181 zip code, you will notice that the Market Action Index in at 22 – This index measures the current rate of sale versus the amount of inventory. Index below 30 favors buyers – prices are not yet moving higher as excess inventory is consumed but if tightening continues and the market moves into the Seller’s Zone, we may see upward pressure on pricing.
If you want a no-obligation home value report for your property, please visit MiamismVALUE.com and we’ll be happy to send you a personalized report.
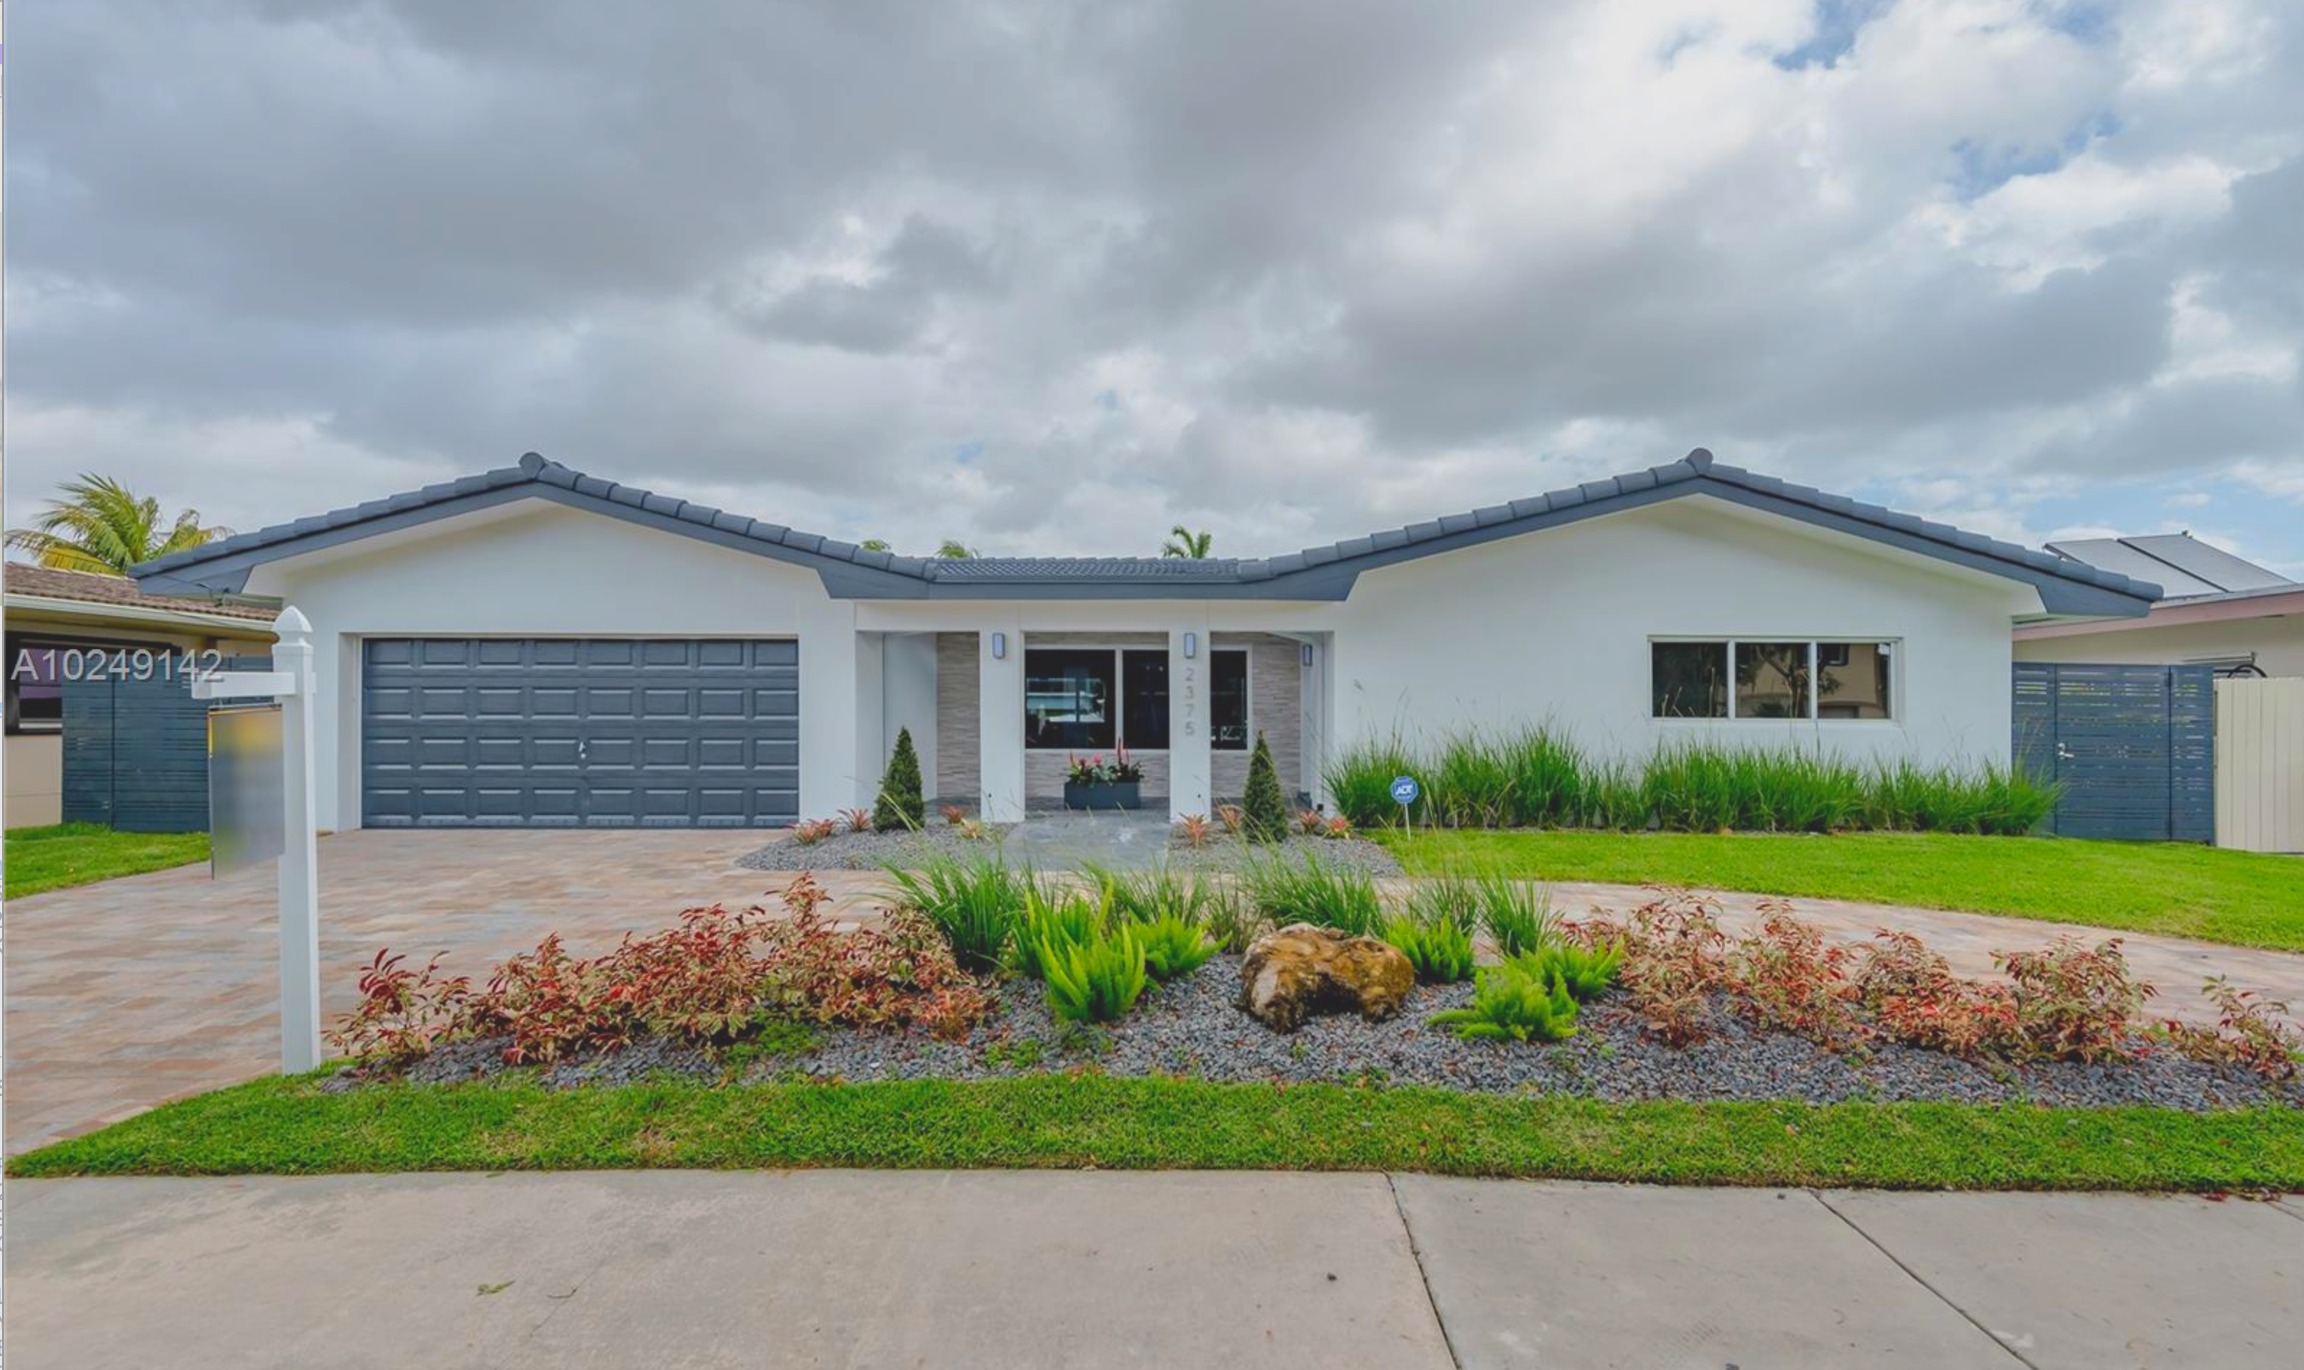
Keystone Point House of The Month
This month, The Miamism Sales Team recommends the completely remodeled home at 2375 Arch Creek Drive. This 3 bedroom / 2 bathrooms home has 3,101 SF of living space and sits on a 9,375 SF lot with 75’ of water frontage. It has a pool, new kitchen, impact windows, 65’ foot dock and no fixed bridges to ocean.
It’s being offered at $1,470,000 ($474/SF)
For additional photos and property information, please see below. Contact us to schedule a private showing appointment.