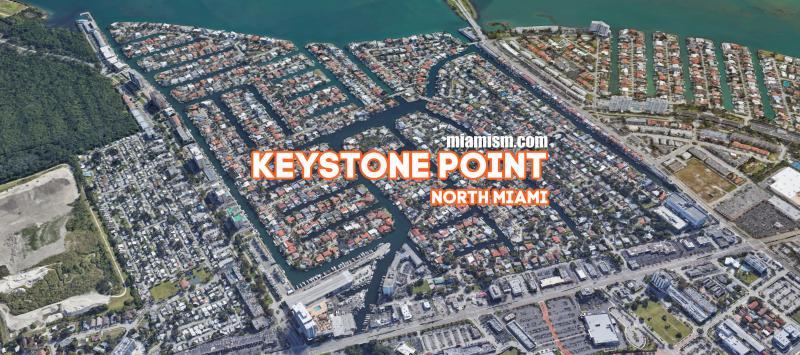
How is the Keystone Point Real Estate Market Doing?
There are currently 24 Keystone Point homes for sale: (compared to 27 last month)
- Highest priced listing: $2,500,000 for the 2014 construction with 5 bedrooms / 4 bathrooms, 3,891 SF at 1955 Ixora Rd
- Lowest priced listing: $498,888 for the non-waterfront 2/1 at 1920 Keystone Blvd.
- Pending Sales (properties under contract): 8
- Closed sales in October: 4 (compared to 9 in September)
- Median Sales Price in October: $2,270,000
DOWNLOAD KEYSTONE POINT 3-D MARKET ANALYZER REPORT HERE
The Keystone Point homes sold in October were the following:
- 12907 Banyan Rd – 3 bedrooms / 2 bathrooms, 1,944 SF on 8,550 SF lot with 75′ of water frontage. Listed for $1,299,000 in August and selling for $1,285,000 ($650/SF)
- 13200 N Bayshore Dr – 4 bedrooms / 3.5 bathrooms, 2,796 SF on 9,375 SF lot with 75′ of water frontage. Originally listed for $1,625,000 in September of 2019, had a few price reductions and sold for $1,225,000 ($548/SF)
- 13085 Ortega Ln – 4 bedrooms / 4 bathrooms, built in 2016 with 4,198 SF on 9,375 SF lot with 75′ of water frontage. Originally listed for $2,480,000 in April of 2019, had a few price reductions and sold for $2,270,000 ($609/SF)
- 13045 Coronado Dr – New construction with 5 bedrooms / 5 bathrooms, 5,291 SF on 9,375 SF lot with 75′ of water frontage. Listed for $2,650,000 and sold for $2,575,000 ($487/SF)
DOWNLOAD KEYSTONE POINT 3-D MARKET ANALYZER REPORT HERE
Keystone Point Average Price per Square Foot
The average sold price per square foot in Keystone Point, for homes on the water, in October was $574. The average price in past months:
- September’s average $497
- August’s average $482
- July’s average $445
- June’s average $496
- May’s average $506
- April’s average $475 (one sale)
- March’s average $406 (one sale)
- February’s average $577
- January’s average $469
- 2019’s average of $416
DOWNLOAD KEYSTONE POINT 3-D MARKET ANALYZER REPORT HERE
Keystone Point Real Estate Market Breakdown

Keystone Point has officially crossed the threshold into a seller’s market with 5 months of inventory. The average price per square foot (in the last 12 months for waterfront homes) remains unchanged at $508, and the price range that is moving the most is under $1.5 Million.
We are seeing buyers not only locally and the rest of the U.S. but also from Argentina – this is key when you are marketing your home for sale. Your REALTOR should know who is buying and where these buyers are coming from. The shocking part is that 47.2% of all transactions are cash!! So if you think Cash is king, think again, it’s pretty common in Keystone. And my favorite stat is that 78.4% of buyers will live in their homes, so this is not a transient neighborhood.

Download our free 8-page report with averages, absorption rates, per bedroom analysis and robust stats by CLICKING HERE. [or contact us and we’ll be happy to email it to you]
Featured Keystone Point Home For Sale

The Keystone Point home pictured above is located at 2243 Bayview Ln. Completely remodeled home with 5 bedrooms / 4 bathrooms, 2,874 SF on 9,375 SF lot (75′ of water frontage). It has a typical great room from mid-century construction with open-plan and large, comfortable spaces. We love 50’s homes!
Boater’s house all the way and was reduced from $1.8 Million to $1,750,000 ($609/SF)
Please contact us for additional information for this and all homes in Keystone and surrounding areas. We are your architecture REALTORS, ready to help yo with all of your real estate needs.