Keystone Point Real Estate Market Report
There are currently 40 Keystone Point homes for sale: (compared to 39 in August)
- Highest priced listing: $4,400,000 for the new construction at 2380 Bayview Ln (please see below)
- Lowest priced listing: $465,000 for the single-family vacant lot (not on the water) with 12,000 SF located at 1857 NE 124 St
- Pending Sales (properties under contract): 3
- Closed sales in September: 2 (compared to 1 in August)
- Median Sales Price in September: $578,000
The 2 Keystone Point homes that sold in September, were the following:
- 1945 S Hibiscus Dr – non-waterfront home with 2 bedrooms / 1 bathrooms, 1,300 SF of living space on 8,475 SF lot. It was originally listed in February for $450,000 and sold for $400,000 ($308/SF)
- 1905 N Hibiscus Dr – canal-front in need of new seawall with 3 bedrooms / 2 bathrooms, 2,169 SF of living space on 8,023 SF lot with 70′ of water frontage. Home was listed on and off since 2015 with original price of $765,000 and sold for $756,000 ($349/SF)
Keystone Point Price per Square Foot
The average price per square foot for Keystone Point Homes on the water in September was $349 with only one single sale, compared to previous months:
- August average $413
- July average $432
- June average $388
- May average $388
- April average $372
- March average $475
- February average $428
- January average $462
- 2016’s average of $432.
We told you last month that the average price per square foot in Keystone Point in the first 8 months of 2017 (waterfront homes), was $432. This number usually represents a home in average condition (meaning it will need work and will not be remodeled to 2017 standards). It’s always advantageous to look at the condition of the top 3 sales and bottom 3 sales in order to make a fair assessment of price when buying or selling.
Important factors to note is that inventory remains steady and so do sales. If demand increases, we should see prices beginning to increase because of simple supply and demand analytics.
The Market Action Index for 33181 increased to 23 from last month’s 22. An Index above 30 implies a Seller’s Market and below 30, favors the buyer. As the supply and demand trends continue, the market moves into the Seller’s zone, and we are likely to see upward pressure on pricing.
If you want a no-obligation home value report for your property, please visit MiamismVALUE.com and we’ll be happy to send you a personalized report.
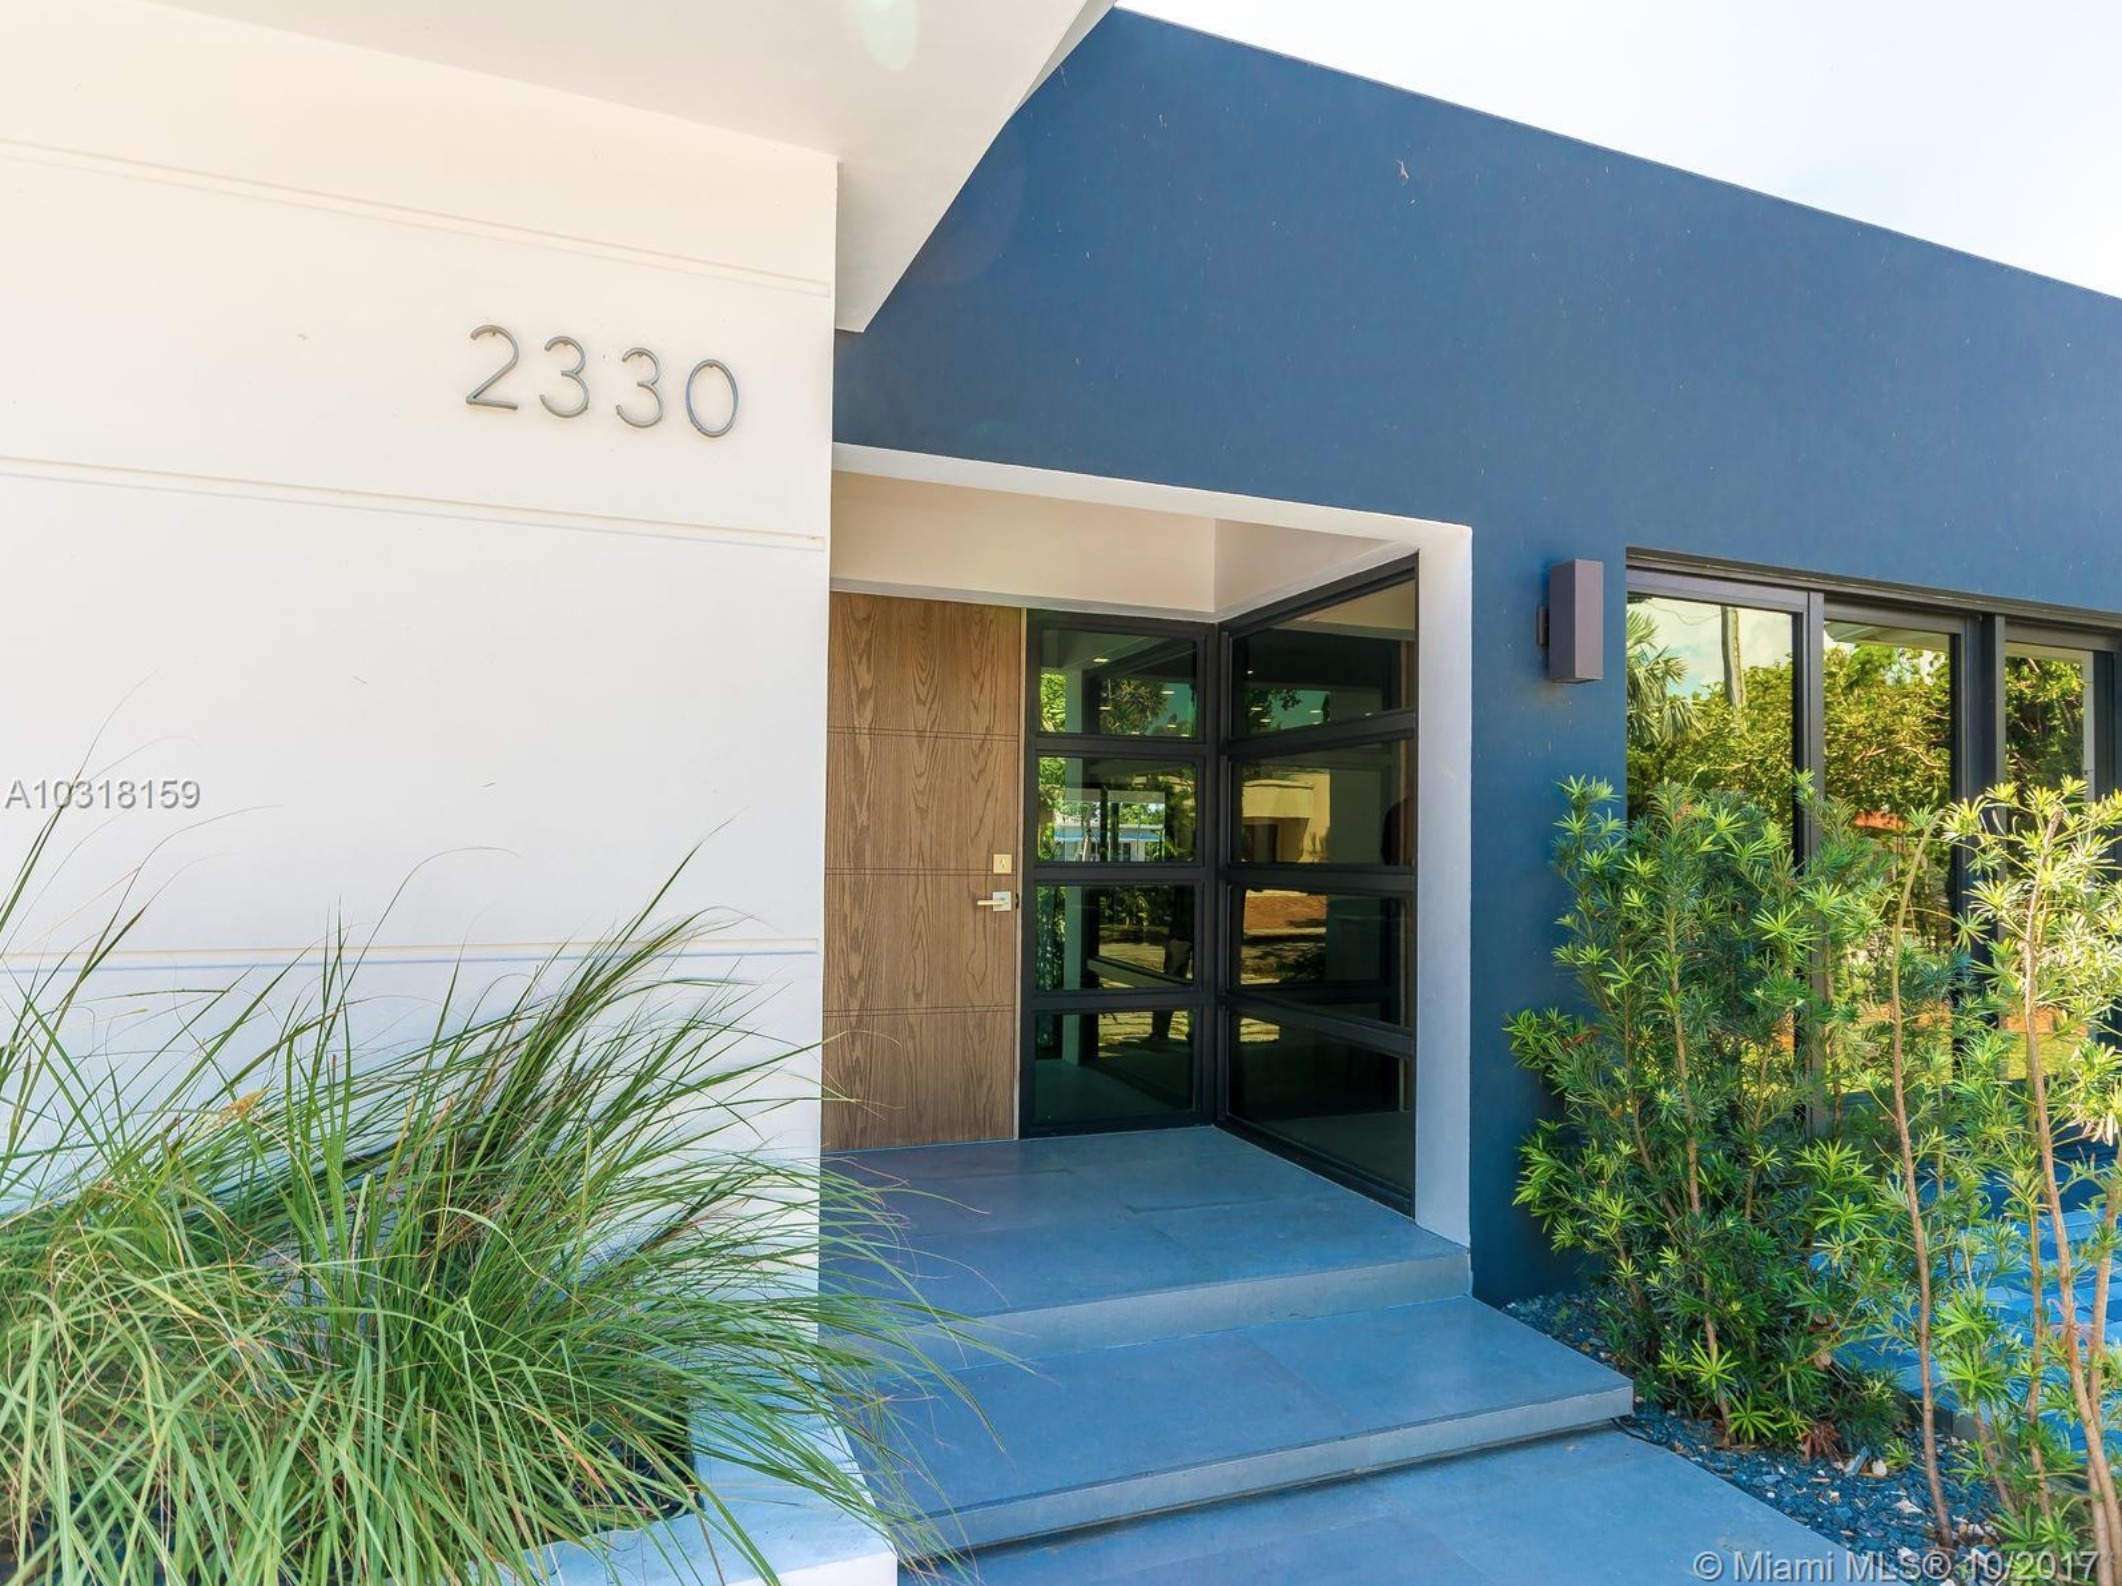
Keystone Point House of The Month
This month, The Miamism Sales Team recommends the completely remodeled home at 2330 Magnolia Dr. I am personally in love with this property because the finishes are flawless and you have to see to believe. It’s a canal front home with no fixed bridges, it has 5 bedrooms / 4.5 bathrooms, 3,400 SF of living space on a 9,375 SF lot with 70′ of water frontage. It has a brand new 60′ dock, new plumbing, electrical and impact windows and all work was done with permits.
It’s being offered at $1,999,900 ($588/SF)
For additional photos and property information, please see below. Contact us to schedule a private showing appointment.