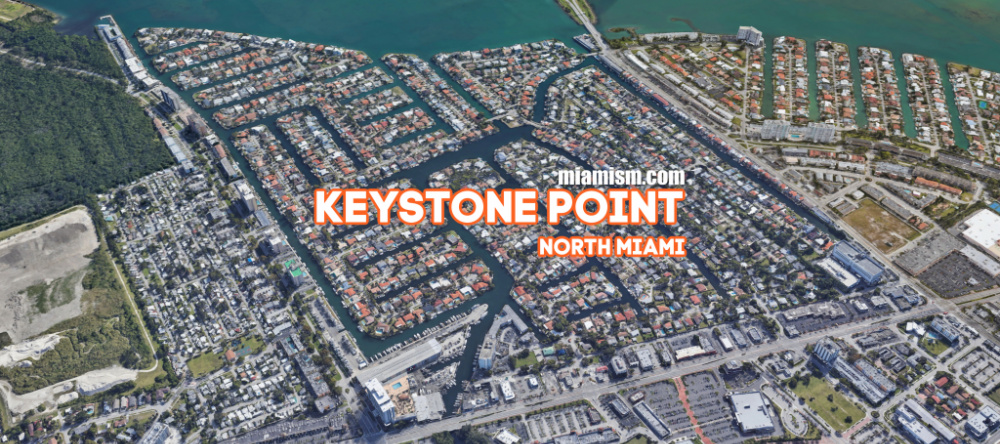
Keystone Point Real Estate – monthly market report – November 2021
How is the Keystone Point Real Estate Market Doing?
There are currently 14 homes for sale (compared to 19 last Month):
- Highest priced listing $7.35M for the open bay home at 13255 Biscayne Bay Drive with 102′ of water frontage, 4 bedrooms / 3.5 bathrooms, 5,000+ square footage and chance to buy adjacent property as well ($1,458/SF)
- Lowest priced listing $1,250,000 for the 3/3 non-waterfront home at 12620 Ixora Rd ($809/SF)
- Pending Sales (Properties under contract): 15
- Median Sales Price in November: $1,351,000
- Closed Sales in November: 6 ( compared to 3 in October)
DOWNLOAD MIAMISM 3D MARKET ANALYZER REPORT
What sold in Keystone Point last month?
For a list of all properties sold in November please email us at Keystone@miamism.com
DOWNLOAD MIAMISM 3D MARKET ANALYZER REPORT
What is the average price per square foot in Keystone Point?
The average sold price per square foot in Keystone Point in November for homes on the water was $529, compared to:
- October’s average $860
- September’s average $803
- August’s average $765/SF
- July’s average $654/SF
- June’s average $829/SF
- May’s average $757/SF
- April’s average $687/SF
- March’s average $604/SF
- February’s average $563/SF
- January’s average $542/SF
- 2020’s average of $522/SF
DOWNLOAD MIAMISM 3D MARKET ANALYZER REPORT
Top 3 Sales in Keystone Point in November (by square footage)
- Non-waterfront home at 1865 Alamanda Dr. This 2 bedrooms / 1 bathroom home with 956 SF and 9,300 SF lot was listed for $700,000 on 11/6 and sold for full price less than a month later ($732/SF) *cash transaction
- Non-waterfront home at 2250 Keystone Blvd with 3 bedrooms / 3 bathrooms, 2,369 SF on 14,491 SF lot. It was listed for $1.2 Million in October and sold for $1,351,000 ($570/SF)
- New construction at 13385 Ortega Lane with 5,291 SF, 5 bedrooms / 5 bathrooms, 9,375 SF lot with 75′ of water frontage. Listed December of 2020 for $2.79 Million and selling for $2,806,659 ($530/SF) **cash transaction
DOWNLOAD MIAMISM 3D MARKET ANALYZER REPORT
Keystone Point Deep Market Stats
We provide a comprehensive 3D market report with in-depth data from the last 12 months that you can download HERE.

Some key points you should know:
- Seller’s market with 3 months of inventory at current rate of sales.
- Average Sales Price increased to $1.7 Million
- Sweet spot in sales are homes priced between $1-2 Million
- 57.7% of all purchase are cash
- 77.4% of all purchases are for primary residences
- Average discount is 7% for all purchases in the last 12 months
- Buyers are from the US (no foreign national sales recorded) **local market
