Miami and Miami Beach 3Q Elliman Reports 2014
Here’s our second episode of Elliman Reports for Miami Homes, Miami Condos, Miami Beach homes and Miami Beach condos – showing figures for the 3rd quarter of 2014. Unlike our hyper local real estate market reports that we share on a regular basis like Miami Shores homes, Surfside homes or even Paramount Bay Condo reports, these reports are useful because they provide overall numbers and give you a general idea of how our Miami and Miami Beach real estate markets are doing. Nothing replaces a personally prepared market analysis for your own property, one that compares properties in the near vicinity of your home or condo. Or you can even request an automatic home value report here (by providing an email address): CHECK YOUR CURRENT HOME VALUE If you want to know how your particular area is doing, please email us at marketreports@miamism.com. 
Miami Real Estate Market Report – 2Q 2014
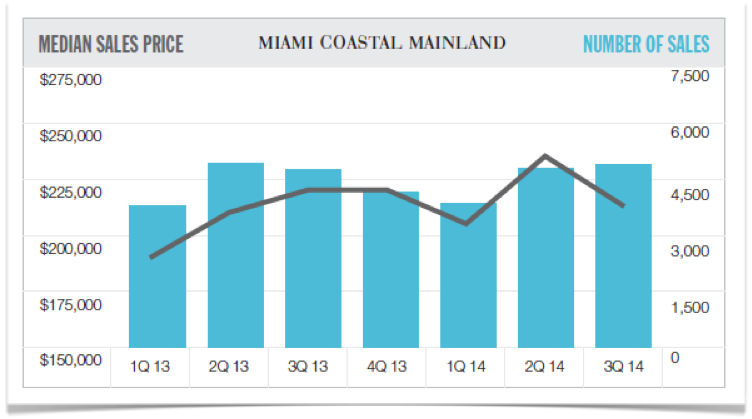
Quarterly Survey of Miami Coastal Mainland Sales for the 3rd Quarter of 2014 shows housing prices were mixed as distressed market share declined. Miami real estate inventory continued to increase from prior year lows and sales edged higher as marketing time declined. 
Median sales price slipped 3.3% to $212,750 from the prior year quarter. Reflecting both a shift in the mix towards the luxury market and a decline in distressed sales, average sales price and average price per square foot jumped 14.3% and 17.4%. The luxury market, specifically condos, posted large gains above year ago levels. The median sales price of a luxury condo surged 34.9% to $1,150,000 while luxury single family homes increased 10% to $1,210,000. Listing inventory jumped 42.7% to 10,695 across all property types from near record lows in the prior year. Single family sales declined because the market pace remained brisk. The single family absorption rate, the number of months to sell all listings at the current pace of sales, was 4.9 months, considerably faster than the 7.2 month regional average of the past four years.
Miami Condos Report
All price indicators show large gains over prior year levels – listing inventory continued to rise as sales increased. Marketing time declined as negotiability expanded. Sales increased despite decline in distressed sale market share.
Miami Homes Report
Overall housing price indicators saw double-digit gains. Sales edged higher as the number of listing expanded. Marketing time and negotiability declined. Distressed sales decreased as non-distressed sales increased.
Miami Luxury Homes and Miami Luxury Condos Report
Increase in all price indicators across both property types. Marketing times for condo and single family sales remained essentially unchanged. Condo and single family listing inventory surged. Absorption rate for condos slowed more than for single family. DOWNLOAD COPY OF ENTIRE 3Q 2014 MIAMI COASTAL MAINLAND SALES HERE This report will also include individual stats for cities of Aventura, downtown Miami, Coconut Grove, Coral Gables, Brickell, South Miami, Pinecrest and Palmetto Bay.
Miami Beach Real Estate Market Report – 2Q 2014
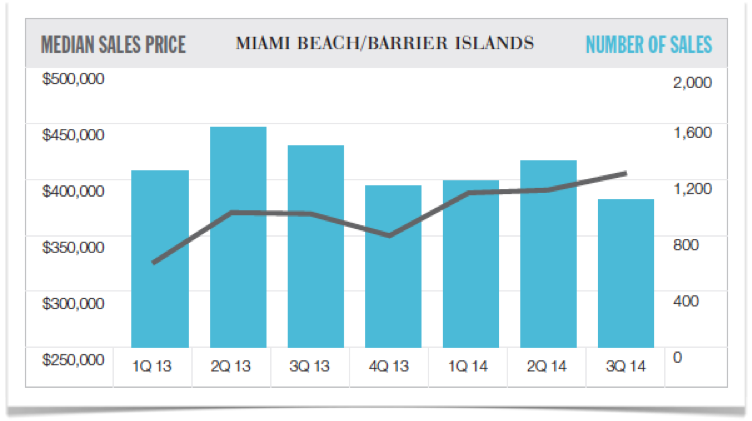
Quarterly survey of Miami Beach / Barrier Islands Sales for the 3rd quarter of 2014 shows price indicators increased, pulling in more inventory. Marketing times declined as negotiability stabilized. Fewer distressed sales. 
Housing prices continued to rise along Miami Beach and the Barrier Islands, drawing more inventory into the market. Median sales price for condos and single family homes increased 9.8% to $405,000 from the same period last year. The luxury market, reflecting the top 10% of all sales, outpaced the overall market. The median sales price of luxury condos jumped 29.7% to $2,400,000, while luxury single family homes surged 44.7% to $6,500,000 respectively from the prior year quarter. The shift to higher priced sales was reflected in the 17% and 66.2% higher entry thresholds for both luxury categories. The frenetic pace of the market is easing. The absorption rate, the number of months to sell all inventory at the current rate of sales, increased by 4.6 months to 10.9 months over the past year. The number of condo and single family sales fell 26.7% to 1,057 from the prior year quarter, including a 35% drop in distressed sales. Reacting to lower sales volume, listing inventory expanded 26.9% to 3,852 from record lows in the prior year. Listing inventory remained 12% below the three-year quarterly average.
Miami Beach Condos Report
Price indicators for Miami Beach condos increased across the board. Inventory continued to rise as sales declined. Three quarters of purchases made with cash.
Miami Beach Homes Report
Price indicators for Miami Beach homes continued to rise. Sales decreased as inventory increased. 57% of purchases made with cash.
Miami Beach Luxury Homes and Miami Beach Luxury Condos Report
Price indicators for Miami Beach luxury condos continued to outpace the overall market. Days on the market and negotiability stabilized. Price indicators for Miami Beach luxury homes surged as larger homes sold. Marketing time slowed, reflecting shift towards larger sized sales. DOWNLOAD COPY OF ENTIRE 3Q 2014 MIAMI BEACH / BARRIER ISLANDS SALES HERE  This report will also include individual stats for cities of Sunny Isles, Bal Harbour, Bay Harbor, Surfside, North Bay Village, Miami Beach Islands, North Beach, Mid-Beach, South Beach, Key Biscayne and Fisher Island. **The Douglas Elliman Report series is recognized as the industry standard for providing the state of the residential real estate market. The report includes an extensive suite of tools to help readers objectively identify and measure market trends, provide historical context to current information and provide comprehensive analysis of the results. Prepared by Miller Samuel, Inc. CHECK YOUR CURRENT HOME VALUE GET A FREE SELLER GUIDE
1 thought on “Miami and Miami Beach 3Q Elliman Reports 2014”
Comments are closed.

Miami and Miami Beach 3Q Elliman Reports 2014 http://t.co/bIQA7TnpJt