Miami Shores Real Estate – April 2022 – monthly market report
How is The Miami Shores Market Doing? Compared to a year ago?
There are currently 30 homes for sale: (compared to 31 a year ago in April)
- Highest priced listing is $9.5 Million for the bay front home at 1680 NE 104th St with 4 bedrooms / 3.5 bathrooms, 2,559 Sq.Ft. on 18,093 Sq. Ft lot with 100′ of open bay frontage. This property was originally listed for $8.5 M on the 14th of April and increased $1 Million 11 days later. ($3,713/Sq.Ft.)
- Lowest priced listing is $750,000 for the 3/3 home at 30 NE 97th St with 1,762 Sq.Ft. on a 8,625 Sq.Ft. lot. MLS shows the home sold for $625,000 in December of 2021 and listing says “cash only” ($426/Sq.Ft.)
- Pending Sales (properties under contract): 24 (compared to 44 a year ago)
- Median Sales Price in April: $1,200,000 (compared to $767,000 a year ago)
- Closed sales in April: 17 (compared to 33 in April of 2021)
What is the average price per square foot in Miami Shores?
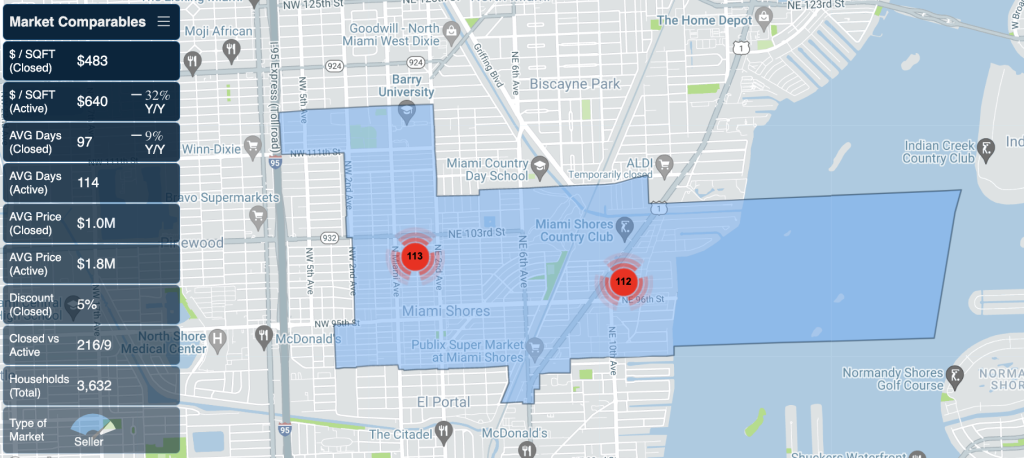
The average sold price per square foot in Miami Shores in April for homes not on the water was $689 compared to $435 a year ago!
- March 2022’s average $528
- February 2022’s average $540
- January 2022’s average $622
- 2021’s avarage of $431
- 2020’s average of $338
The average sold price per square foot in Miami Shores in April for homes ON the water was $1,123 compared to $593 a year ago:
- March’s average – no sales
- February’s average – no sales
- January’s average – no sales
Miami Shores Real Estate Micro-Stats
Feel free to download our complete market report for the last 12 months, showing micro-stats for Houses for Sale Miami Shores

- Seller’s Market with 1 month of inventory (multiple-offers/bidding wars)
- Price-range moving the most is between $1-1.5 Million
- 40% of all deals are cash transactions.
- 69% of all buyers do so as primary residents (homestead and live in their homes)
DOWNLOAD MIAMI SHORES 3D MARKET REPORT
