
Welcome to our Miami Shores Real Estate monthly market report – we publish these the first week of the month, so come back to see how the market is doing and how it compares to the past year.
How is The Miami Shores Market Doing? Compared to a year ago?
There are currently 25 homes for sale compared to 56 a year ago:
- Highest priced listing is $8.5 Million for the bay front home at 999 NE 13th Ave – a 5 bedroom / 4.5 bathroom home with 3,429 Sq.Ft. of living area, a 13,953 Sq.Ft. lot with 83′ of unobstructed bay frontage with dock. This home was listed in April of 2021 ($2,479/Sq.Ft.)
- Lowest priced listing is $599,000 for the fixer-upper at 10495 NE 2nd Ave – a 3 bedroom / 2 bathroom home with 1,926 Sq.Ft. of living area and 7,950 Sq.Ft. lot. This home was listed on Feb. 1 ($311/Sq.Ft.)
- Pending Sales (properties under contract): 41
- Median Sales Price in January: $1,320,000 (compared to $630,000 a year ago)
- Closed sales in January: 4 (compared to 11 in January of 2021)
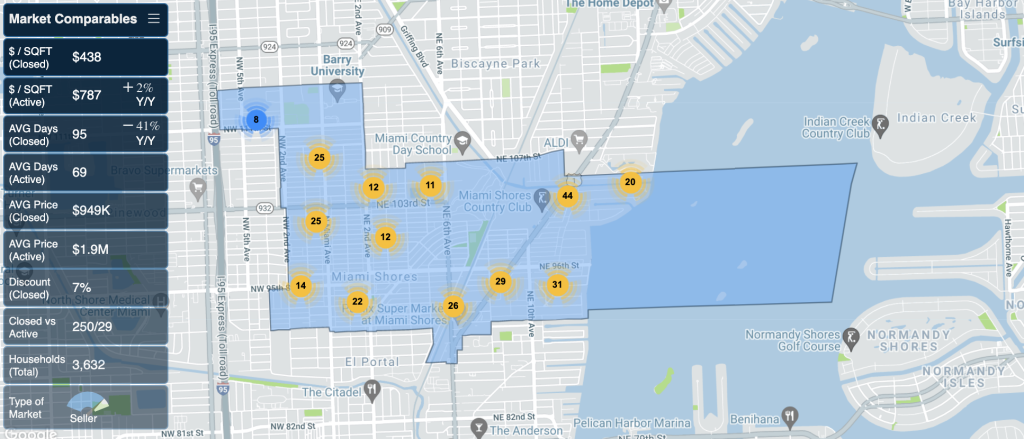
What is the average price per square foot in Miami Shores?
The average sold price per square foot in Miami Shores in January for homes not on the water was $622 compared to $332 a year ago!
There were no waterfront homes sold in Miami Shores in January.
Miami Shores Real Estate Micro-Stats
Feel free to download our complete market report for the last 12 months, showing micro-stats for Real Estate Miami Shores.
- Seller’s Market with 1 month of inventory (multiple-offers/bidding wars)
- Price-range moving the most is between $1-1.5 Million
- 69.3% of all deals are conventional loans
- 75.2% of all buyers do so as primary residents (homestead and live in their homes)