How is the Miami Shores Real Estate Market Doing?
There are currently 99 homes for sale: (compared to 99 in July)
- Highest priced listing is $5,590,000 for the bay front home located at 9901 NE 13 Ave with 93′ of open bay frontage, 14,024 SF lot and almost 5,000 SF of living space.
- Lowest priced listing is $365,000 for the 2/1 home at 202 NW 92 St
- Pending Sales (Properties under contract): 30 (compared to 32 in July)
- Median Sales Price in August: $749,000
- Closed sales in August: 16 (compared to 18 in July)
What sold in Miami Shores in August?
The 16 Miami Shores homes sold in August ranged from the brand new construction at 1263 NE 101 St which was originally listed for $2,499,000 and sold for $1,760,000 ($407/SF), to the fixer upper at 125 NW 100 Ter which sold for $355,000 ($251/SF).
Price per square foot ranged from $204 for the home on Mirror Lake at 10401 NE 4th Ave (listed in June for $575,000 and selling for $555,000), to $407 for the property listed above, which was also the highest sale.
What is the average price per square foot in Miami Shores?
The average sold price per square foot in Miami Shores in August for homes not on the water was $324, compared to:
- July $291
- June $320
- May $312
- April $309
- March $291
- February $283
- January $289
- 2017’s average of $293
There were 2 waterfront homes sold in August but they were both on Mirror Lake in Central Shores, not navigable water frontage. The average price per square foot for these 2 homes was $238.
Miami Shores Opinion
You will notice a big discrepancy in price per square foot from July to August and that has to do with the type of home that sold last month. When you have a couple of really high sales due to new construction or meticulous condition, it inflates the price for that particular month. I always find it humorous when economists compare sales from the same month the previous year, as if that will give us an indicator of the market. The only true indicator is grabbing at least 6 months of stats for a very particular area or subdivision and then comparing to previous 6 months. Month to month analysis do not provide true stats.
This past month, only 3 out of the 16 transactions, were cash deals.
Please note that overall inventory continues to be low in Miami Shores and the market has slowed down a bit compared to historic movement for the months of August and September.
The Market Action Index has increased to 32 which is an indicator of a slight Seller’s Advantage.
Home sales continue to outstrip supply and the Market Action Index has been moving higher for several weeks. This is a Seller’s market so watch for upward pricing pressure in the near future if the trend continues.
Additional Miami Shores Reports
In addition to these monthly reports that we prepare the first week of each month, we also have our REAL-TIME reports that you can sign up with or request a home value report from MiamismValue.com.
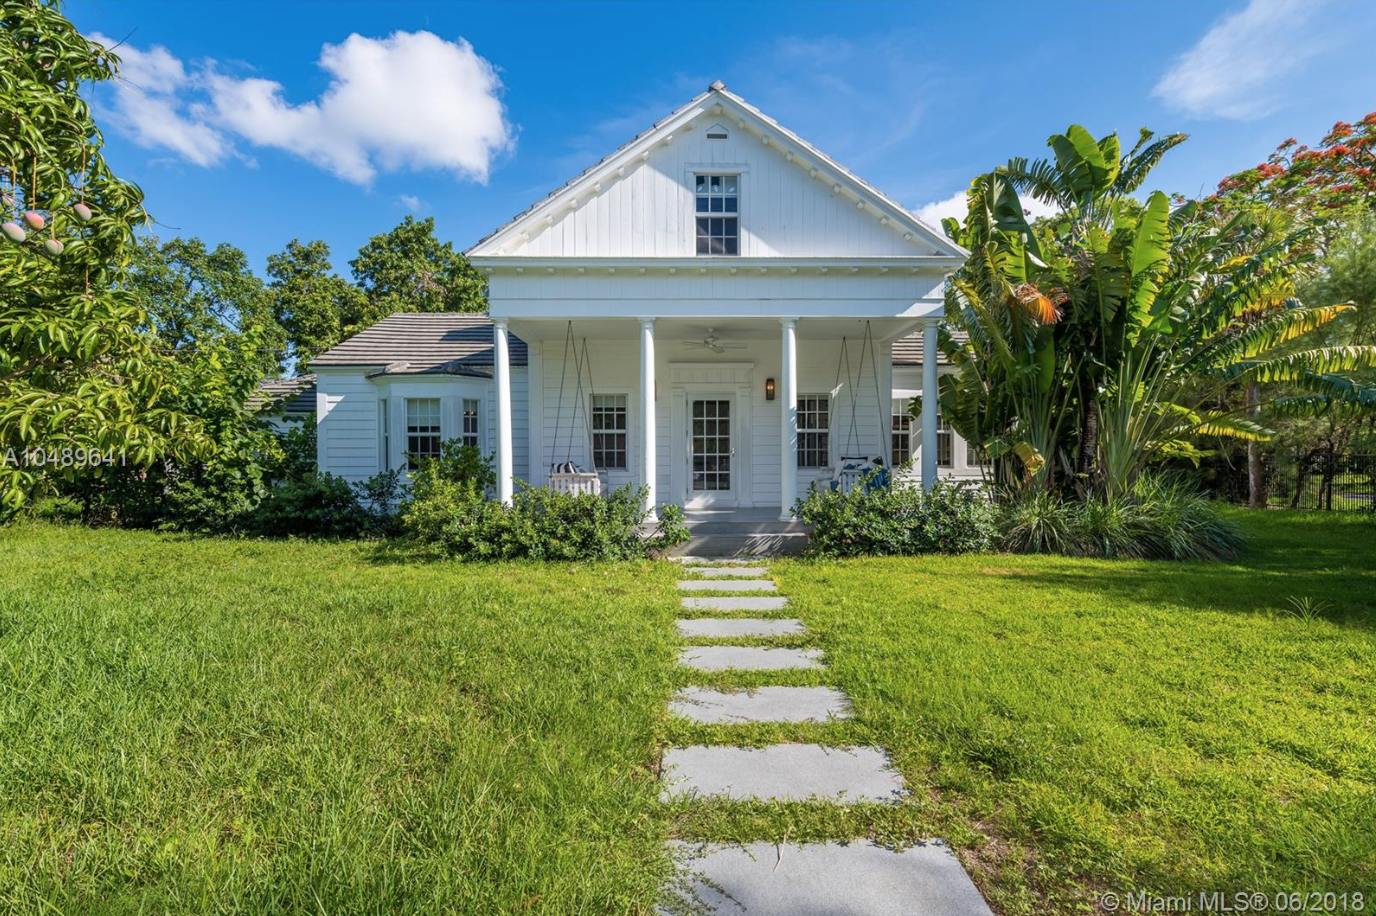
Miami Shores House of The Month
The Miamism Sales Team recommends the amazing historic estate at 912 NE 95 Street. Although we would usually not recommend a wood-frame home because of exorbitant insurance costs, we have found that these homes can be insured for moderate costs depending on complete condition of the property. This particular home was built in 1935 which most likely means that Dade-County Pine was used for the construction and it is absolutely beautiful with a Florida Vernacular feel, huge lot over 17,000 square feet, 5 bedrooms / 4.5 bathrooms, over 4,500 sq.ft. of living area, pool and TONS of charm!!
Asking Price $1,325,000 ($289/SF)
CLICK HERE for additional information or see below and please contact us to schedule a private showing appointment.