Miami Shores, Florida, real estate market reports. Get inside information on Miami Shores and stats showing price per square foot and which homes are selling for top dollar with the help of your Miami Shores Realtors, The Miamism Sales Team.

Miami Shores Homes – Real Estate Market Report
We prepare monthly market reports for Miami Shores but also encourage you to take a look at our annual reports which put all stats into perspective. 2014 Miami Shores Real Estate Stats can be seen HERE. There are currently 72 Miami Shores homes for sale (5 more than in January):
- Highest priced listing is $5,995,000 (1600 NE 103 St: 6 bedrooms / 5 bathrooms / 2 half baths, 6,733 sq.ft. of living space on 20,534 sq.ft. lot – directly on Biscayne Bay)
- Lowest priced listing is $250,000 – short sale at 19 NW 109 St (house needs a lot of work, new roof, plumbing, electrical, floors, etc)
- Pending Sales (Properties under contract): 43 (same as last month)
- Closed sales in February: 9 (compared to 16 in January)
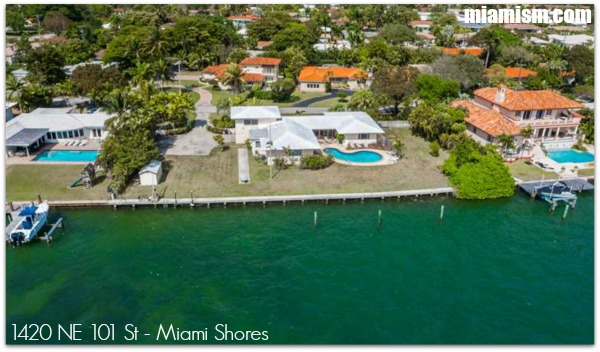
The 9 Miami Shores homes in February ranged from $775,000 for the historic Deco home located at 537 NE 96 St, to $358,000 for a small 3 bedroom / 2 bathroom home at 464 NE 92 St. There were no waterfront home sold in February but a new bay front listing at 1420 NE 101 St with a 23,471 sq.ft. lot and 204′ of water frontage! It’s listed for $4.5 Million and is a mid-century modern in need of updates ….imagine the possibilities on that size lot!
There is also a new historic home for sale in Miami Shores- it’s a 1925 Kiehnel & Elliott Gem located in Central Shores at 310 NE 99 Street and it has a national historic designation. It’s listed for $1.2 Million – call us for more information, especially since our specialty is historic homes.  The average price per square foot in Miami Shores in February was $277, compared to January’s $225 and 2014′s average of $236. The highest sale doesn’t always represent the highest price per square foot sold. The house at 1100 NE 91 Terrace was the highest sale per square foot, coming in at $402. This is important to note because the highest price per square foot in 2014 was $408. There is still low inventory and high demand in Miami Shores, especially for larger homes with 4 or more bedrooms. We added a new system to miamism.com this week and the idea is to provide monthly trend reports directly to your inbox. These trend reports will not only give you information about the neighborhood, but it will also give you an estimated home value for your particular property. We need to repeat that it is an automated system, not like these reports that we produce manually and give you inside information and our opinion. To sign up to our Home Trend Reports, go to MiamismTRENDS.com and fill in your information. If you have any doubts on the automated value, please contact us and we will make adjustments and corrections according to upgrades and location of your particular home. Call us Today for a listing appointment!
If you are interested in getting a list of all properties currently for sale in Miami Shores, we will be happy to send you a digital copy at your request. We can also send you monthly market reports directly to your inbox. Feel free to email us at MiamiShores@miamism.com
Comments
6 responses to “Miami Shores Real Estate Market Report for February 2015”
Miami Shores Real Estate Market Report for February 2015 http://t.co/7SkPpZofeh
RT @ines: Miami Shores Real Estate Market Report for February 2015 http://t.co/7SkPpZofeh
Miami Shores Real Estate Market Report for February 2015 – http://t.co/8o5KQl9rx4 (via@ines)
Miami Shores Real Estate Market Report for February 2015 – http://t.co/FHovDmUx1W
Miami Shores Real Estate Market Report for February 2015 http://t.co/5auKEGPMaC
Miami Shores Real Estate Market Report for February 2015 http://t.co/qKCvBrrcxf