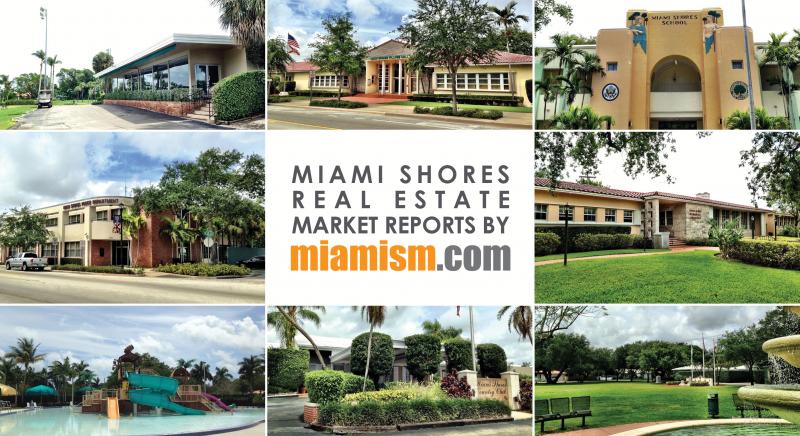
How is the Miami Shores Real Estate Market Doing?
There are currently 99 homes for sale: (compared to 111 homes at the end of 2017)
- Highest priced listing is
$6,200,000$5,499,000$4,999,995 for the bay front home at 1600 NE 103 St (2-story Italian Mediterranean with 20,534 SF LOT and 103′ of open bay water frontage – see information below)
- Lowest priced listing is $365,000 for 2 bedroom/1 bathroom home at 202 NW 92 St
- Pending Sales (Properties under contract): 31 (compared to 22 at the end of 2017)
- Median Sales Price in January: $630,000
- Closed sales in January: 14
The 14 Miami Shores homes sold in January were the following:
- 1040 NE 96 St – Beautiful Spanish Mediterranean home with 4 bedrooms / 3 bathrooms, 3,749 SF and 14,200 SF lot. Originally listed for $1,599,000 in August of 2017, reduced to $1,499,000 and sold for $1,402,000 ($383/SF) **cash sale
- 1030 NE 105 St – Canal front home with one fixed bridge to bay with 3 bedrooms / 2 bathrooms, 2,809 SF and 11,250 SF lot (plus 75′ of water frontage). Originally listed in January of 2016 for $1,200,000 had several price reductions and sold for $855,000 ($370/SF) **cash sale
- 9632 NE 5th Avenue Rd – Big 1937 house in need of updates with 6 bedrooms / 4 bathrooms, 3,656 SF and 12,636 SF lot. Originally listed for $1,249,000 in August of 2016 with several price reductions and finally selling at $715,000 ($196/SF) <<great deal
- 102 NE 91 St – newly remodeled home with 3 bedrooms / 3 bathrooms, 2,375 SF on 10,368 SF lot. Originally listed for $685,000 in May of 2016, then increased to $695,000 in October of 2017 and sold for $690,000 ($290/SF)
- 1421 NE 103 St – Original Colonial East of Biscayne with 3 bedrooms / 3 bathrooms, 3,114 SF on 9,810 SF lot. Listed for $725,000 in December and selling for $677,500 ($355/SF)
- 5 NE 107 St – beautifully remodeled home with 4 bedrooms / 3 bathrooms, 2,950 SF on 9,225 SF lot. Originally listed in January of 2016 for $727,500, reduced to $675,000 and sold for $665,000 ($261/SF) **cash sale
- 96 NW 92 St – updated home with 3 bedrooms / 2 bathrooms, 2,347 SF on 8,925 SF lot. Listed for $625,000 and sold for $630,000 ($315/SF)
- 455 NE 91 St – updated home with 3 bedrooms / 2 bathrooms, 2,614 SF on 6,350 SF lot. Listed for $599,000 in October and selling for $599,000 ($348/SF)
- 130 NW 97 St – remodeled home with 2 bedrooms / 2 bathrooms , 1,959 SF on 8,625 SF lot. This home sold for $390,000 in January of 2017, was remodeled and relisted for $550,000 and sold for $522,050 ($293/SF)
- 11 NW 97 St – 1948 home in original condition with 3 bedrooms / 2 bathrooms, 1,983 SF on 10,200 SF lot. Listed for $595,000 in September of 2017 and sold for $520,000 ($278/SF)
- 101 NW 101 St – beautiful home with 2 bedrooms / 2 bathrooms, 1,480 SF on 9,210 SF lot. Listed for $499,000 and sold for $455,200 ($401/SF)
- 833 NE 96 St – Foreclosure on busy street with 2 bedrooms / 2 bathrooms, 2,052 SF on 8,625 SF lot. Listed in September of 2017 for $430,000 and selling for $358,050 ($219/SF)
- 549 NE 106 St – Cash only property with spalling and structural problems with 2 bedrooms / 2 bathrooms, 1,537 SF on 9,150 SF lot. Listed for $395,000 and selling for $330,000 ($215/SF) **cash sale
- 10 NW 100 St – 3 bedrooms / 2 bathrooms with 2,097 SF on 6,095 SF lot. Listed for $399,000 and sold for $319,000 ($201/SF) **cash sale
The average sold price per square foot in Miami Shores in January for homes not on the water was $289 compared to 2017’s average of $293.
There was only one Miami Shores waterfront home sold in January, on the 105th St canal with a fixed bridge and that sold for $370/SF. The average sold price per square foot for Miami Shores waterfront homes in 2017 was $318.
Although we saw a slight drop in price per square foot in January compared to 2017’s average, please remember that it’s normal to see fluctuations each month depending on the type of sales that were evidenced. Always take into consideration at least 6 months of sales to get a better idea. What’s interesting to note is the increase in cash sales in Miami Shores – 4 out of the 14 sales was a cash transaction which is almost 29% of the deals. Not bad for a neighborhood that is used to seeing mostly financed deals.
We remind you that in addition to preparing these monthly market reports, we also have Miami Shores REAL-TIME market reports which offer weekly “market action index”, “market segments”, and “real-time market profile”. National and County-wide news sources can be slow and do not accurately represent what is happening in our local market. That’s where we can help. Our reports are localized, easy to read and provide you with a well-rounded up to date view of how the market is behaving. If you want a no-obligation home value report, please go to MiamismValue.com.
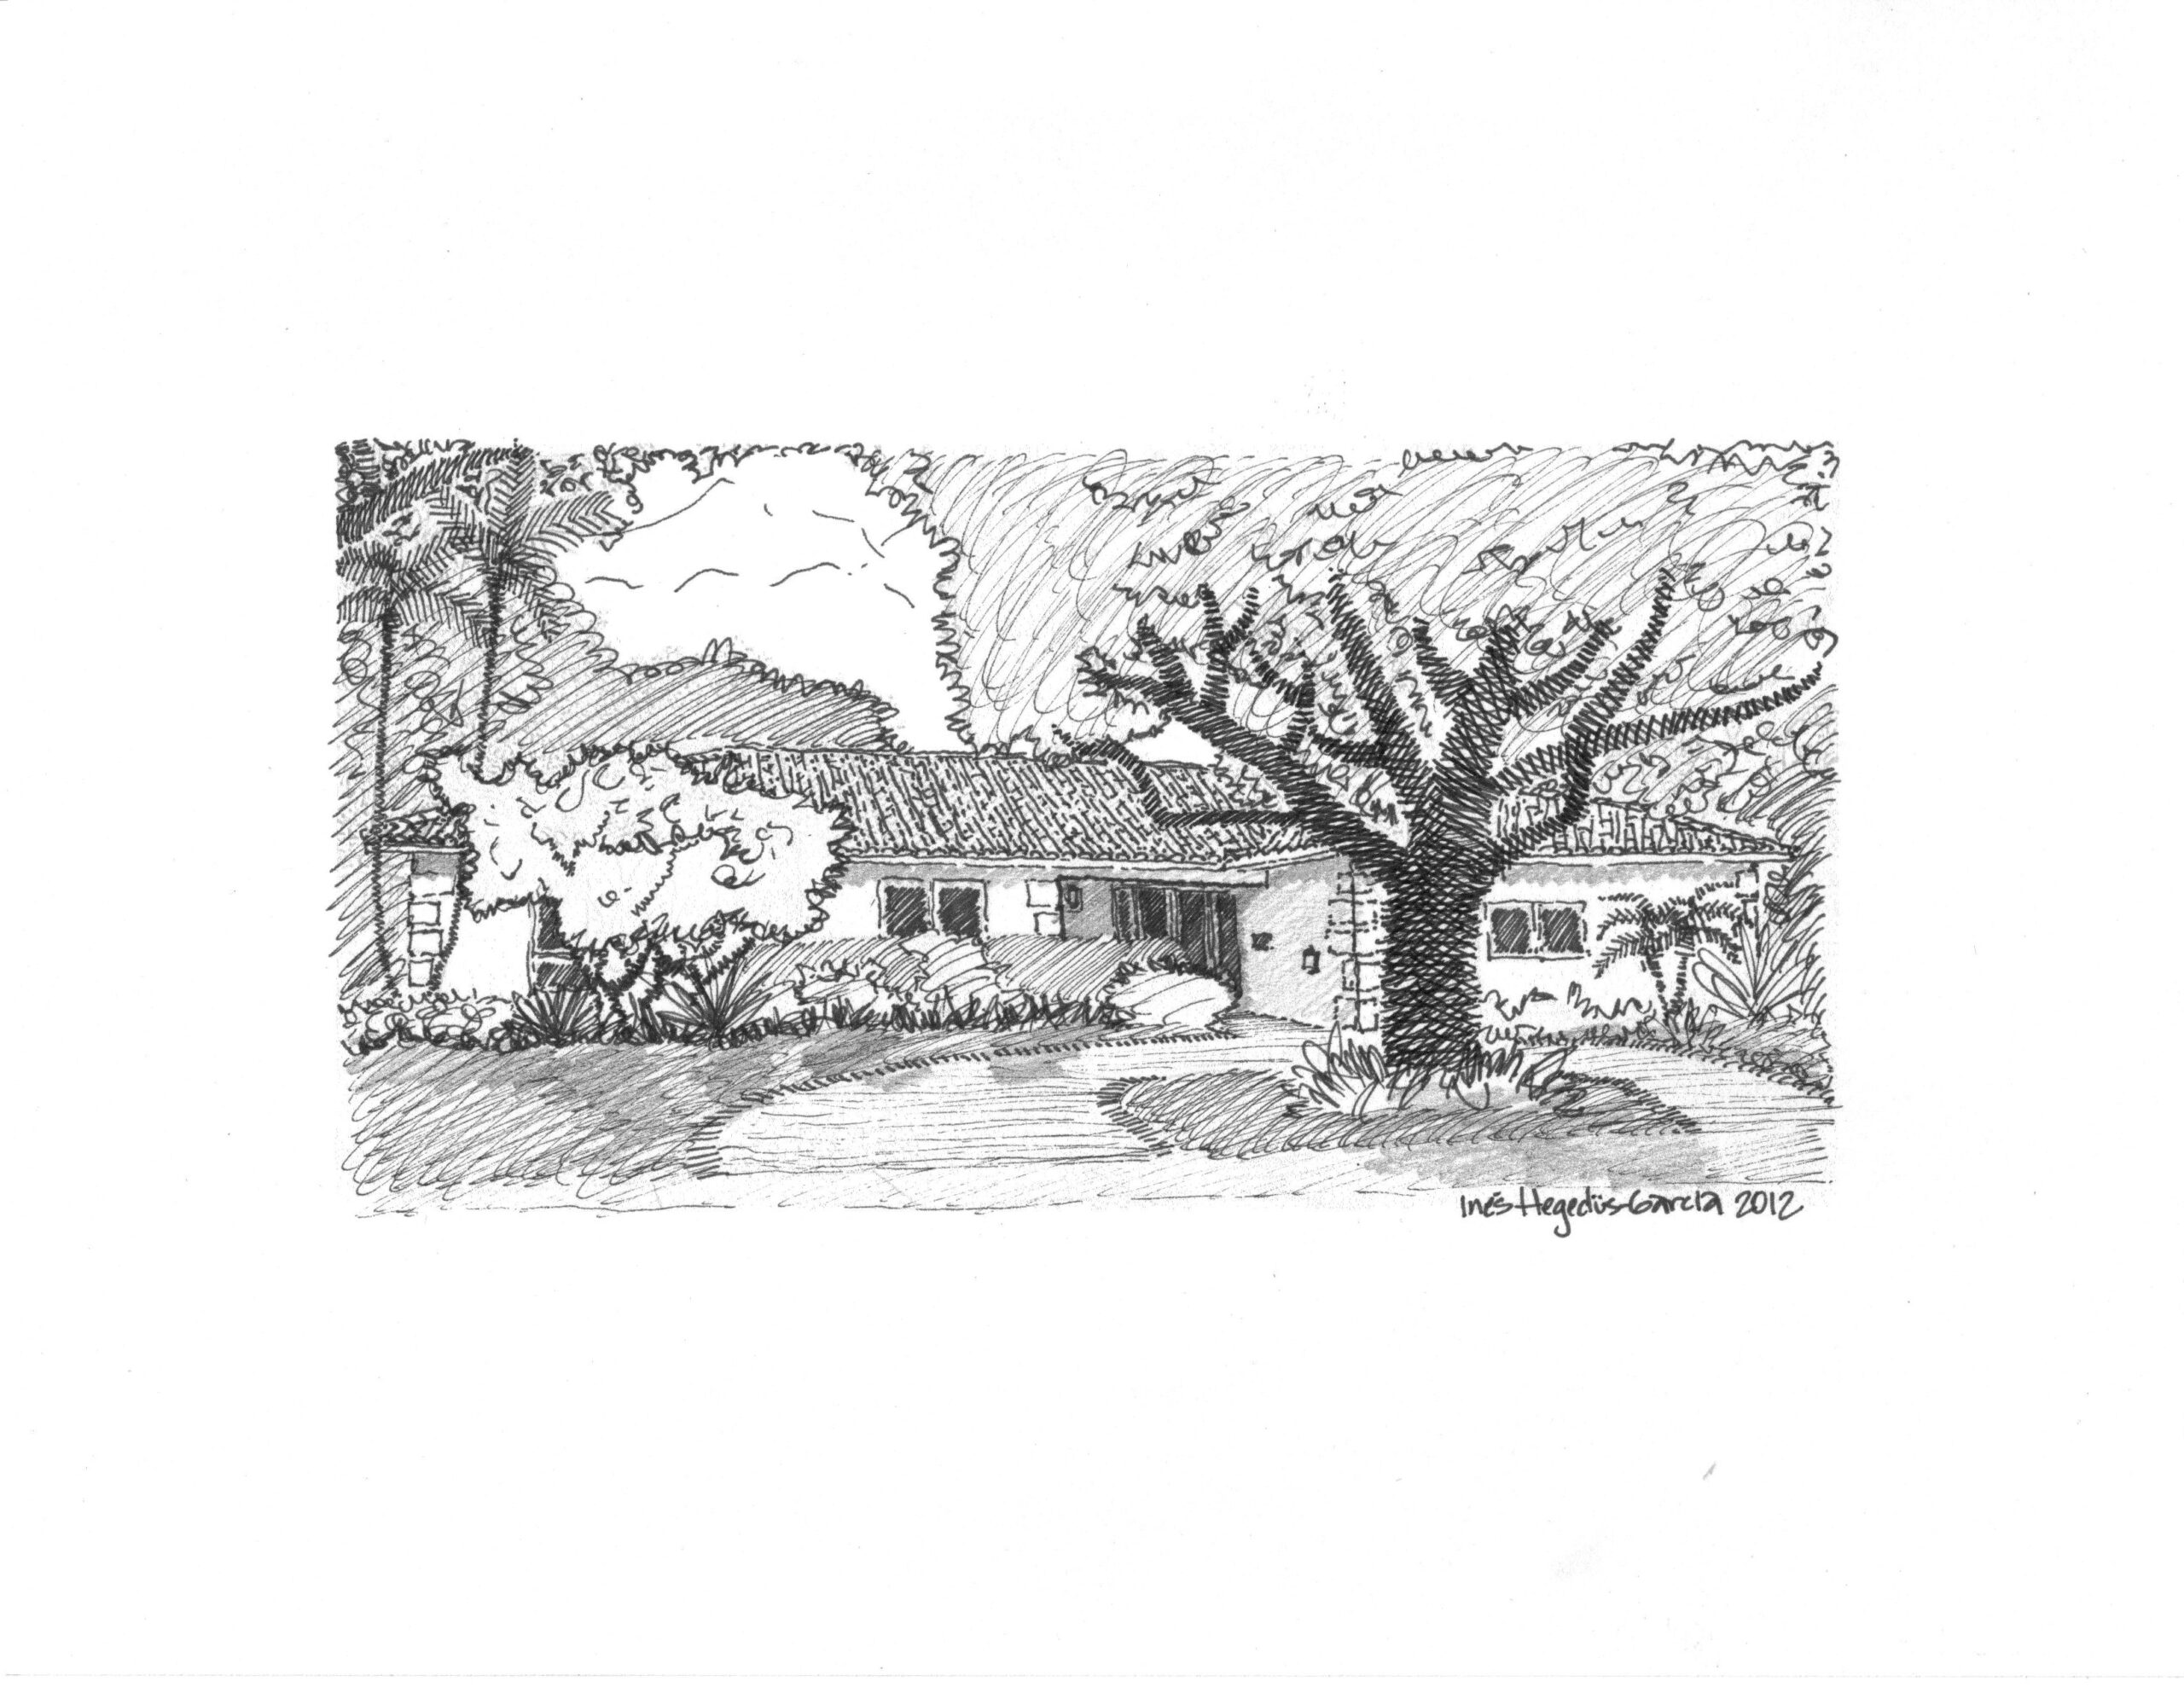
Miami Shores House of The Month
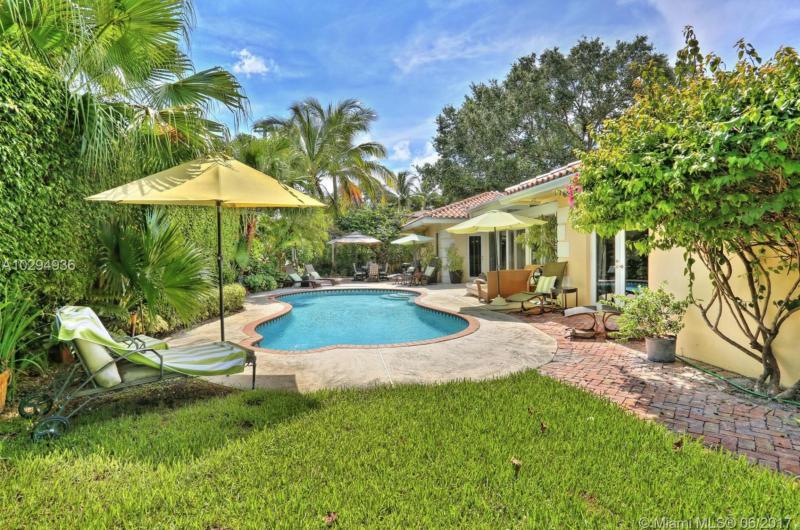
The Miamism Sales Team recommends the exquisite home located at 420 NE 95 St. A rare 5 bedroom home with 2.5 bathrooms and 3,576 SF of living space. The home sits on a 12,900 SF lot and was once featured in the annual Heidi Hewes Home For The Holidays Tour to benefit cancer research. Take a look at the pen and ink rendering I did for this home when it was on the tour.
This home has been custom built and has impact windows and doors, gorgeous features and beautiful pool area.
It’s offered at $1,199,000 ($335/SF)
Please contact us for additional information and to schedule a private showing appointment.
Miami Shores Dates to Remember
- Plaza 98 on Saturday, February 10th at 5:00 PM – Game Night!
- 2018 Miami Shores Mayor’s Gala