Miami Shores Real Estate Market Report – March 2018
How is the Miami Shores Real Estate Market Doing?
There are currently 117 homes for sale: (compared to 105 in February)
- Highest priced listing is
$6,200,000$5,499,000$4,999,995$4,575,000 for the bay front home at 1600 NE 103 St (2-story Italian Mediterranean with 20,534 SF LOT and 103′ of open bay water frontage)
- Lowest priced listing is $290,000 for the foreclosure with 3 bedrooms / 2 bathrooms at 94 NW 95 St
- Pending Sales (Properties under contract): 25 (same as in February)
- Median Sales Price in March: $499,000
- Closed sales in March: 17 (compared to 10 in February)

The 17 Miami Shores homes sold in March were the following:
- 1201 NE 96 St – brand new construction with 5 bedrooms / 5.5 bathrooms – 4,242 SF of living space on 12,823 SF lot – listed for $2.1 Million and selling for $1.8 Million ($486/SF)
- 1195 NE 100 St – modern gen with 3 bedrooms / 2.5 bathrooms and 2,708 SF of living space on 11,513 SF lot – originally listed for $1.3 Million and selling for $1,070,000 ($395/SF)
- 433 NE 91 St – 4 bedrooms / 2 bathrooms with 1,808 SF of living space on 9,525 SF lot – listed for $699,000 and selling for $685,000 ($379/SF)
- 1020 NE 98 St – 3 bedrooms / 3 bathrooms with 2,165 SF of living space on 8,475 SF lot – originally listed for $749,000 in June of 2016 with a few reductions and finally selling for $625,000 ($294/SF) **CASH transaction
- 100 NE 92 St – 3 bedrooms / 3 bathrooms with 2,281 SF of living space on 13,000 SF lot – listed for $680,000 and selling for $625,000 ($292/SF)
- 67 NW 92 St – 4 bedrooms / 3.5 bathrooms with 2,644 SF of living space on 7,500 SF lot – originally listed for $718,000 in May of 2017, with a few price reductions and selling for $585,000 ($221/SF)
- 140 NW 102 St – 3 bedrooms / 2 bathrooms with 1,784 SF of living space on 8,100 SF lot – listed for $540,000 and selling for $500,000 ($280/SF)
- 10610 NE 11 Ave – 4 bedrooms / 3 bathrooms with 2,381 SF of living space on 9,750 SF lot – listed for $499,000 and selling for $499,000 ($300/SF)
- 118 NW 97 St – 2 bedrooms / 2 bathrooms with 1,414 SF of living space on 8,625 SF lot – listed for $454,000 and selling for $454,000 ($321/SF)
- 81 NW 98 St – 2 bedrooms / 2 bathrooms with 2,077 SF of living space on 7,650 SF lot – listed for $499,000 and selling for $440,000 ($212/SF)
- 9426 NW 2nd Ave – 3 bedrooms / 2 bathrooms with 1,362 SF of living space on 7,500 SF lot – listed for $420,000 and selling for $390,000 ($286/SF)
- 261 NE 105 St – 2 bedrooms / 1 bathroom with 1,139 SF of living space on 8,000 SF lot – listed for $419,999 and selling for $405,000 ($356/SF)
- 10555 NE 2nd Ave – 3 bedrooms / 2 bathrooms – foreclosure with 2,446 SF of living space on 8,625 SF lot – originally listed for $471,700 with several pending contracts that appear to have fallen through, and finally selling for $373,000 ($152/SF) **CASH transaction
- 186 NW 107 St – 2 bedrooms / 1 bathroom with 1,494 SF of living space on 9,464 SF lot – originally listed for $429,000 on December of 2017 and selling for $381,000 ($285/SF)
- 118 NW 103 St – 3 bedrooms / 2 bathrooms with 1,433 SF of living space on 7,725 SF lot – originally listed for $459,000 with several price reductions and selling for $390,000 ($272/SF)
- 142 NE 103 St – 3 bedrooms / 1 bathroom with 1,524 SF of living space on 8,475 SF lot – originally listed for $389,000 ($241/SF)
- 290 NW 111 St – 2 bedrooms / 1 bathroom fixer-upper with 1,059 SF of living space on 10,140 SF lot – listed for $200,000 and selling for $175,000 ($182/SF) **ASSUMED financing
The average sold price per square foot in Miami Shores in March for homes not on the water was $291, compared to:
- February $283
- January $289
- 2017’s average of $293
According to our REAL-TIME market reports for Miami Shores, we are in a seller’s market with a slight seller’s advantage. The Market Action Index measures the current rate of sales versus the amount of inventory and an index above 30 implies a Seller’s Market – We are at 30:
In the last few weeks the market has achieved a relative stasis point in terms of sales to inventory. However, inventory is sufficiently low to keep us in the Seller’s Market zone so watch changes in the MAI. If the market heats up, prices are likely to resume an upward climb.
The number 1 indicator of price is LOCATION, this is without a doubt. If you live in Miami Shores you know what the desirable areas area for both crime and proximity to water and the action. Homes East of the boulevard sell for top dollar, no matter the condition. Homes in Central Shores compete according to condition and the further west you go, the price per square foot drops, unless the home is small and architecturally charming.
Only 2 out of the 17 closings was a cash deal, this continues to fluctuate from month to month and we keep a close eye.
In addition to these monthly reports that we prepare the first week of each month, we also have our REAL-TIME reports that you can sign up with or request a home value report from MiamismValue.com.
Miami Shores House of The Month
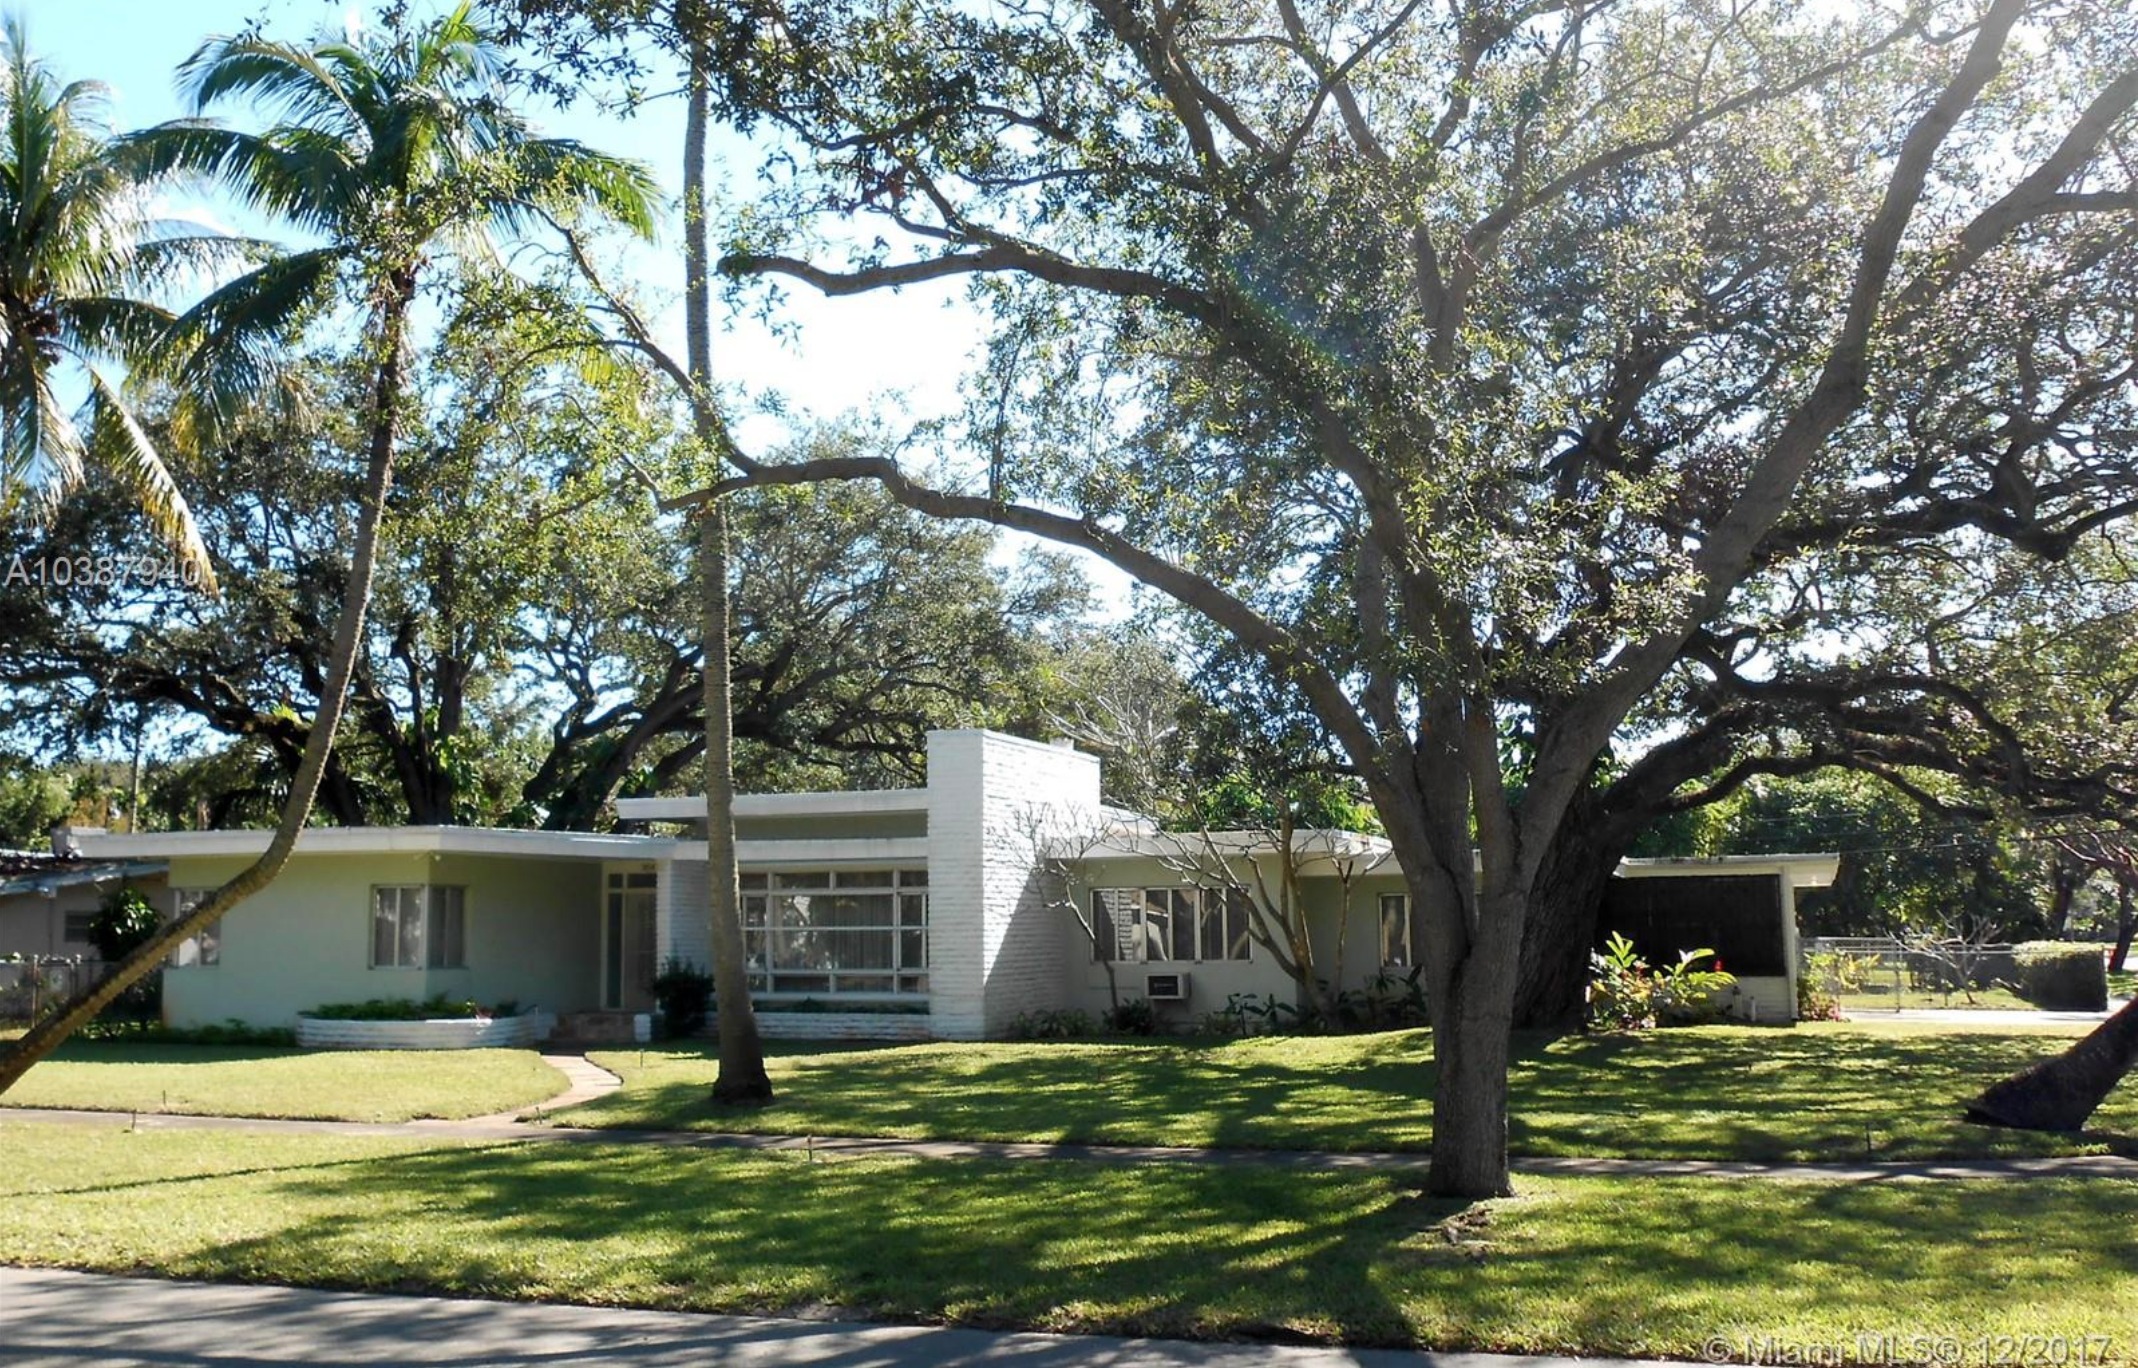
The Miamism Sales Team recommends the true, Mid-century Modern home located at 304 NE 93rd Street. We don’t take the meaning of “mid-century modern” lightly and this is a pristine example in original condition, waiting for the right hands to bring it to its intended splendor.
The house has terrazzo floors protected by wall to wall carpeting, original bathrooms and windows, gorgeous window proportions and even wall a/c units. It’s a 3 bedroom / 2 bathroom home with 2-car garage on a huge 15,875 SF lot. It needs to be completely updated but the bones don’t get any better than this. It’s a bit overpriced at $340/SF, considering it needs to be completely updated, but I’m sure there’s room to negotiate.
The listing price is $795,000
Please click on THIS LINK to get additional photos and information about the property and contact us to schedule a private showing appointment.
