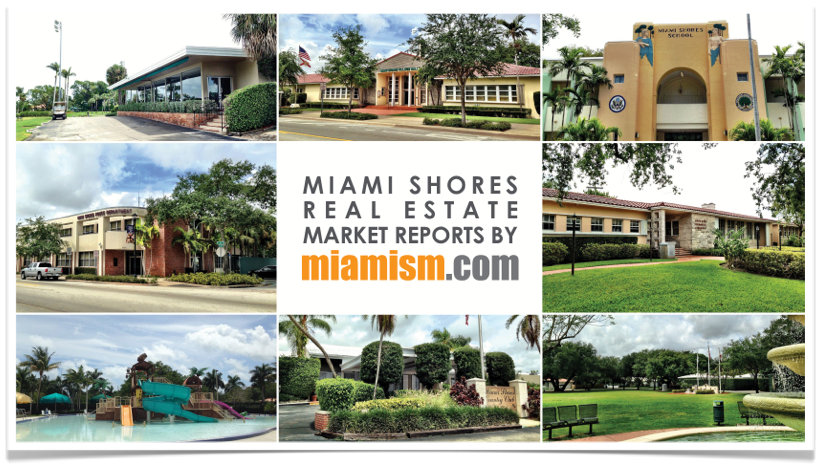
Miami Shores Real Estate Market Report for May 2014
Miami Shores Homes – Real Estate Market Report
There are currently 85 Miami Shores homes for sale: (5 less than last month)
- Highest priced listing is $3,200,000 (9999 NE 13th Ave) – Bay front property listed in March of 2014
- Lowest priced listing is $209,000 (166 NW 100 Te) – Short Sale originally listed for $250,000 last month.
- Pending Sales (Properties under contract): 44 (9 more than last month)
- Closed sales in May: 16 (1 more than last month)
The 16 Miami Shores homes sold in May were the following:
- 1280 NE 101 St – Originally listed for $1,500,000 in December of 2013, lowered to $1,150,000 and selling for $1,150,000 ($247/sq.ft)
- 290 NE 93 St – immaculate Mid-century modern, originally listed for $839,00 in August of 2013, with several price reductions and selling for $745,000 ($310/sq.ft.)
- 253 NE 101 St – 1924 Spanish Mediterranean, originally listed for $699,000 in September 2013, with several price reductions and selling for $625,000 ($282/sq.ft.)
- 1085 NE 97 St – mid-century originally listed for $629,000 in March of 2014 and selling for $594,500 ($266/sq.ft.)
- 565 NE 101 St – originally listed for $598,000 and selling for $584,850 ($278/sq.ft.)
- 136 NW 96 St – originally listed for $519,000 and selling for $480,000 ($284/sq.ft.)
- 10642 NE 10 Pl – Miami Shores Country Club North area in need of work, originally listed for $499,500 in August of 2013, with price reduction and selling at $435,000 ($154/sq.ft.)
- 46 NE 93 St – Listed for $449,000 in March of 2014, and selling for $425,000 ($203/sq.ft.)
- 33 NW 93 St – originally listed for $459,000 in February of 2014 with price reduction and selling for $415,000 ($270/sq.ft.)
- 102 NW 97 St – listed for $379,000, then increased to $399,000 and selling for $382,500 ($230/sq.ft.)
- 150 NW 94 St – listed for $395,000, increased to $398,000 and selling for $387,000 ($228/sq.ft.)
- 150 NW 101 St – listed for $365,000 and pending in just days! selling for $365,000 ($186/sq.ft.)
- 173 NE 107 St – originally listed for $369,000 and selling for $322,500 ($203/sq.ft.)
- 186 NW 109 St – originally listed for $345,000 in December 2013, reduced and selling for $315,000 ($212/sq.ft.)
- 9035 NE 5 Av – foreclosure listed for $319,900 and selling for $319,000 ($147/sq.ft.)
- 435 NW 111 St – fixer upper listed for $169,900 and selling for $170,000 ($116/sq.ft.)
The average sales price per square foot for Miami Shores homes in May was $226 compared to:
- April $222
- March $248
- February $190
- 2013 annual average $215
Although we can see the monthly average price per square foot fluctuating a bit, it doesn’t mean the market is doing poorly, on the contrary, it shows a conservative increase which is a clear sign of a strong real estate market. People tend to shy from markets that increase too fast, but Miami Shores remains steady with a slow growth.
There were no Miami Shores waterfront homes sold in May and that inventory remains low. We have buyers looking for waterfront homes to come on the market, so let us know if you are ready to sell.
Notice how price varies depending on location and condition of home. We would be glad to visit your home for a no obligation market analysis of your property, or you can visit these links for the following:
If you are interested in getting a list of all properties currently for sale in Miami Shores, we will be happy to send you a digital copy at your request. We can also send you monthly market reports directly to your inbox. Feel free to email us at MiamiShores@miamism.com
1 thought on “Miami Shores Real Estate Market Report for May 2014”
Comments are closed.

Miami Shores Real Estate Market Report for May 2014 http://t.co/8H4VXwk7Cn