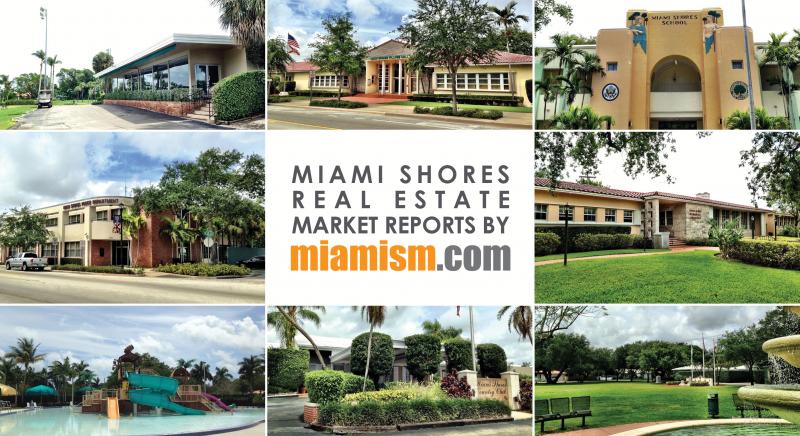
How is the Miami Shores Real Estate Market Doing?
There are currently 98 homes for sale: (compared to 105 last month)
- Highest priced listing is
$6,200,000$5,499,000 for the bay front home at 1600 NE 103 St (2-story Italian Mediterranean with 20,534 SF LOT and 103′ of open bay water frontage – see information below)
- Lowest priced listing is $319,900 for the home at 117 NW 103 St
- Pending Sales (Properties under contract): 31 (compared to 29 in March)
- Median Sales Price in May: $550,000
- Closed sales in May: 17 (compared to 12 in April)
The 17 Miami Shores homes sold in May were the following:
- 9437 NW 2 Pl – 2 bedrooms / 1 bathroom, 1,166 SF on 7,500 SF lot – originally listed for $365,000 in February and selling for $320,000 ($274/SF)
- 141 NS 101 St – 2 bedrooms / 1 bathroom, 1,440 SF on 8,100 SF lot – listed for $399,000 in March and selling for $399,000 ($358/SF)
- 54 NW 106 St – 3 bedrooms / 2 bathrooms, 1,651 SF on 9,225 SF lot – listed for $469,000 in March and selling for $455,000 ($315/SF)
- 77 NW 99 St – 3 bedrooms / 3 bathrooms, 1,838 SF on 10,800 SF lot – listed for $499,000 in August of 2016 and selling for $485,000 ($264/SF)
- 29 NE 95 St – foreclosure with 4 bedrooms / 3.5 bathrooms, 3,026 SF on 14,300 SF lot – listed for $511,980 in April of 2016 and selling for $489,359 ($167/SF)
- 150 NW 100 Ter – 3 bedrooms / 2 bathrooms, 1,879 SF on 8,068 SF lot – listed for $519,000 in February and selling for $507,000 ($298/SF)
- 124 NE 111 St – 3 bedrooms / 2 bathrooms, 2,289 SF on 9,225 SF lot – listed for $550,000 in December of 2016 and selling for $530,000 ($304/SF)
- 9701 NE 4 Av – 3 bedrooms / 2 bathrooms, 2,392 SF on 12,197 SF lot – originally listed for $699,000 in August of 2016 and selling for $500,000 ($250/SF)
- 90 NE 91 St – 3 bedrooms / 2 bathrooms, 1,823 SF on 11,043 SF lot – listed for $638,900 and selling for $600,000 ($329/SF) **sold by Miamism Sales Team
- 74 NE 108 St – 3 bedrooms / 3 bathrooms, 1,965 SF on 9,225 SF lot – listed for $630,000 and selling for $615,000 ($333/SF)
- 925 NE 95 St – 3 bedrooms / 2 bathrooms, 2,230 SF on 11,293 SF lot – listed for $799,000 and selling for $805,000 ($398/SF)
- 9510 Biscayne Blvd – 5 bedrooms / 3 bathrooms, 3,720 SF on 18,095 SF lot – listed for $1,299,000 in February of 2016, had several price reductions and sold for $905,000 ($243/SF)
- 930 NE 96 St – 4 bedrooms / 3.5 bathrooms, 2,588 SF on 10,725 SF lot – originally listed for $1,185,000 in May of 2016, with several price reductions, and selling for $929,000 ($363/SF)
- 1116 NE 92 St – 4 bedrooms / 3 bathrooms, 3,030 SF on 9,375 SF lot – listed for $1,030,000 and selling for $985,000 ($347/SF)
- 124 NE 96 St – 4 bedrooms / 4.5 bathrooms, 4,300 SF on 14,300 SF lot – listed for $1,299,000 and selling for $950,000 ($221/SF)
- 389 NE 99 St – 4 bedrooms / 3.5 bathrooms, 3,252 SF on 8,992 SF lot – originally listed for $1,299,000 in September of 2015 and selling for $1,100,000 ($338/SF)
- 577 NE 96 St – 6 bedrooms / 4.5 bathrooms, 5,893 SF on 19,500 SF lot – one of Miami Shores gems by famed architect Walter DeGarmo – originally listed for $1,790,000 in June of 2016 and selling for $1,250,000 ($276/SF)
The average sold price per square foot in Miami Shores in May for homes not on the water was $299 compared to previous months:
- April Average $266
- March average $230
- February average $254
- January average $270
- 2016’s average of $278
There were no waterfront homes sold in May.
The media keeps telling us that it’s a buyer’s market but the reality is that real estate is hyper local. How in the world can you package The Brickell Condo Market with Miami Shores’ single-family home market, together with Miami Beach, Fisher Island, Hialeah and other communities?? It makes absolutely no sense. What makes sense is for you to know what is happening directly in your community in order to make educated decisions about buying and selling.
With that said, did you see the major increase in price per square foot this month? That will always fluctuate, that’s why we recommend looking at 6 month averages or even a year – the good indicator in 2016’s average and seeing how close you remain to that.
Here’s what we are seeing on the ground. Homes that are upgraded are selling well. Homes that are updated and in a great location are selling for top dollar. Miami Shores is still in an in-between market – not quite buyer’s and sometimes seller’s depending on condition and location of property. Since the market continues to correct itself, it’s key for you to know how your product compares to those top sellers and for you to be realistic about pricing. One thing is clear, it’s no longer a market to overprice. Overpricing will cause property to sit on the market longer and even sell under market (evidenced by closed properties identified above).
We prepare these market reports on a monthly basis at the beginning of every month and we also provide automated real-time market reports to help you stay on top of the pulse. We also provide no-obligation consultations, so feel free to contact us if you are curious about selling your home.
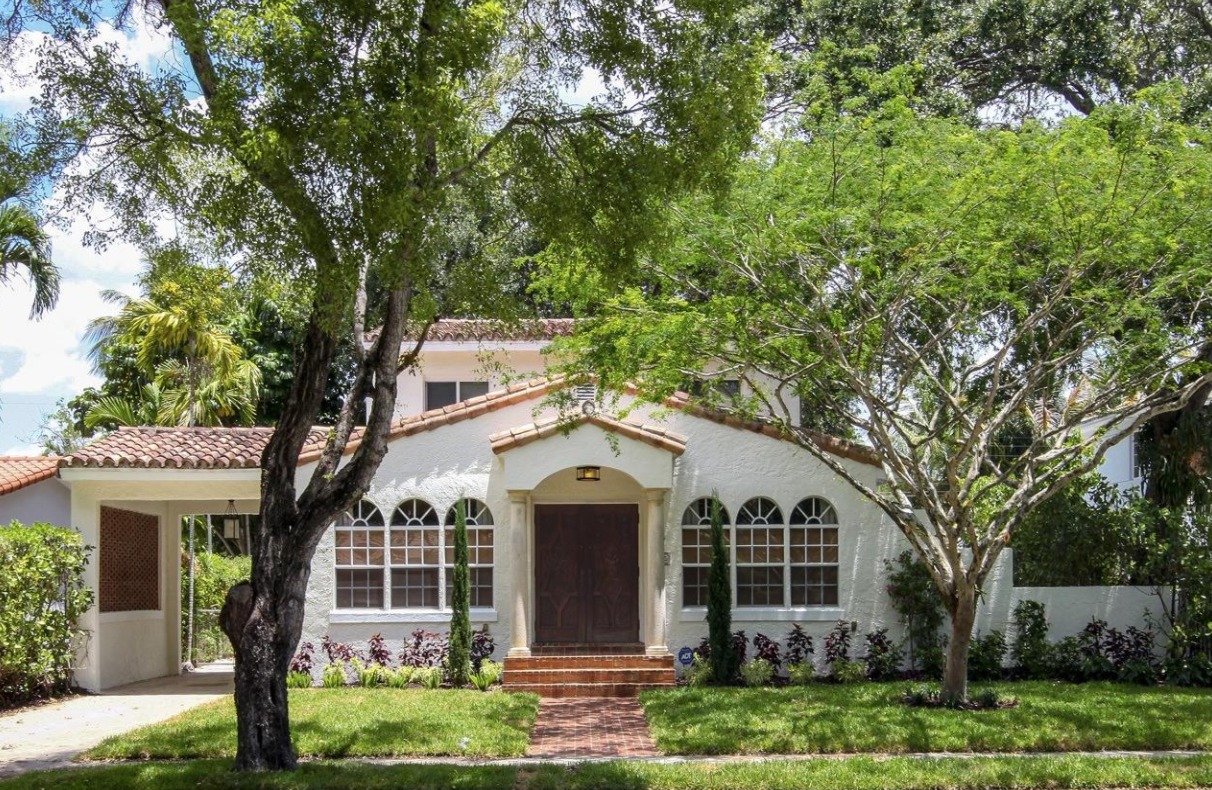
Miami Shores House of The Month
The Miamism Sales Team recommends the Mediterranean revival home located at 275 NE 92 Street. This is a Lester Avery home that was previously owned by a local contractor who did a quality addition to the historic home. It boats 5 bedrooms, 4.5 bathrooms and 3,580 SF of living space. It does have a smaller lot of 8,320 SF but the house is beautiful!! It’s listed for $1,075,000 which is $329/SF and a really great price for such a significant, historic home.
Please see the details below and contact us for additional information or to schedule a showing appointment.