How is the Miami Shores Real Estate Market Doing?
There are currently 107 homes for sale: (compared to 99 homes last month)
- Highest priced listing is
$6,200,000$5,499,000 for the bay front home at 1600 NE 103 St (2-story Italian Mediterranean with 20,534 SF LOT and 103′ of open bay water frontage – see information below)
- Lowest priced listing is $319,900 for the home located at 117 NW 103 St
- Pending Sales (Properties under contract): 23 (compared to 19 in September
- Median Sales Price in October: $471,000
- Closed sales in October: 12 (compared to 8 in September)
The 12 Miami Shores homes sold in October were the following:
- 597 NE 93 St – 3 bedrooms / 3 bathrooms, 2,622 SF of living space on 12,342 SF lot – beautifully renovated home was originally listed for $849,750 in November of 2016, with several price reductions and finally selling for $735,000 ($369/SF)
- 10361 NE 4th Ave – 3 bedrooms / 2.5 bathrooms, 3,106 SF of living space on 8,250 SF lot – home was placed in the MLS for $699,000 on October 1st and sold on October 9th for $675,000 ($239/SF)
- 94 NE 102 St – 2 bedrooms / 1 bathroom home with 1,543 SF of living space on 9837 SF lot – beautifully remodeled home, listed for $568,900 in August and selling for $538,000 ($383/SF)
- 415 NE 102 St – 2 bedrooms / 2 bathrooms with 1,538 SF of living space on 8,850 SF lot – listed for $525,000 in August and selling for $515,000 ($335/SF)
- 186 NW 106 St – 3 bedrooms / 2 bathrooms with 1,792 SF of living space on 9,465 SF lot – listed for $499,000 in July and selling for $500,000 ($399/SF)
- 1175 NE 105 St – 3 bedrooms / 2 bathrooms with 2,284 SF of living space on 8,413 SF lot – listed for $525,000 in October of 2016 and selling for $492,000 ($261/SF)
- 116 NE 97 St – 2 bedrooms / 2 bathrooms with 2,010 SF of living space on 5,750 SF lot – listed for $480,000 in July and selling for $450,000 ($251/SF)
- 70 NW 96 St – 3 bedrooms / 2 bathrooms with 1,633 SF of living space on 10,725 SF lot – listed in June for $465,000 and selling for $435,000 ($266/SF)
- 297 NE 97 St – 3 bedrooms / 2 bathrooms with 1,717 SF of living space on 6,188 SF lot – listed for $519,000 in July of 2016 and selling for $435,000 ($253/SF)
- 119 NW 110 St – 3 bedrooms / 2 bathrooms with 2,016 SF of living space on 9,150 SF lot – listed for $480,000 in April of 2016 and selling for $418,000 ($256,000)
- 142 NW 93 St – 2 bedrooms / 1 bathroom with 1,136 SF of living space on 9,225 SF lot – charming home listed for $399,000 in August and selling for $370,000 ($451/SF)
- 301 NW 106 St – 4 bedrooms / 2 bathrooms with 1,600 SF of living space on 6000 SF lot – rented fixer upper originally listed for $275,000 and selling for $225,000 ($156/SF) **a steal!!
The average sold price per square foot in Miami Shores in October for homes not on the water, was $302, compared to previous months:
- September Average $332
- August Average $280
- July Average $286
- June Average $291
- May Average $299
- April Average $266
- March average $230
- February average $254
- January average $270
- 2016’s average of $278
There were no waterfront homes sold in October.
Slight increase in average price per square foot is exciting, but also gives a false sense of security. Homes that are selling for top dollar are remodeled with current finishes, impact windows and curb appeal. The challenge is those homes that are in good condition but need some work and buyers have difficulty imagining the potential, or worse off, they are scared of the work. (please refer to the house of the month below).
Miami Shores still offers a beautiful array of 20’s, 30’s, 40’s and 50’s architecture and it’s up to buyers to know their wants and needs and up to sellers to be able to show their home’s best light.
The Market Action Index continues to increase gradually – this is the index that measures the current rate of sales versus the amount of inventory. An index above 30 implies a Seller’s Market and it is currently at 27. Although prices and inventory levels are relatively unchanged, the index reflects a slight buyer’s advantage.
Please take a look at our Miami Shores REAL-TIME market reports which offer weekly “market action index”, “market segments”, and “real-time market profile”. National and County-wide news sources can be slow and do not accurately represent what is happening in our local market. That’s where we can help. Our reports are localized, easy to read and provide you with a well-rounded up to date view of how the market is behaving. If you want a no-obligation home value report, please go to MiamismValue.com.
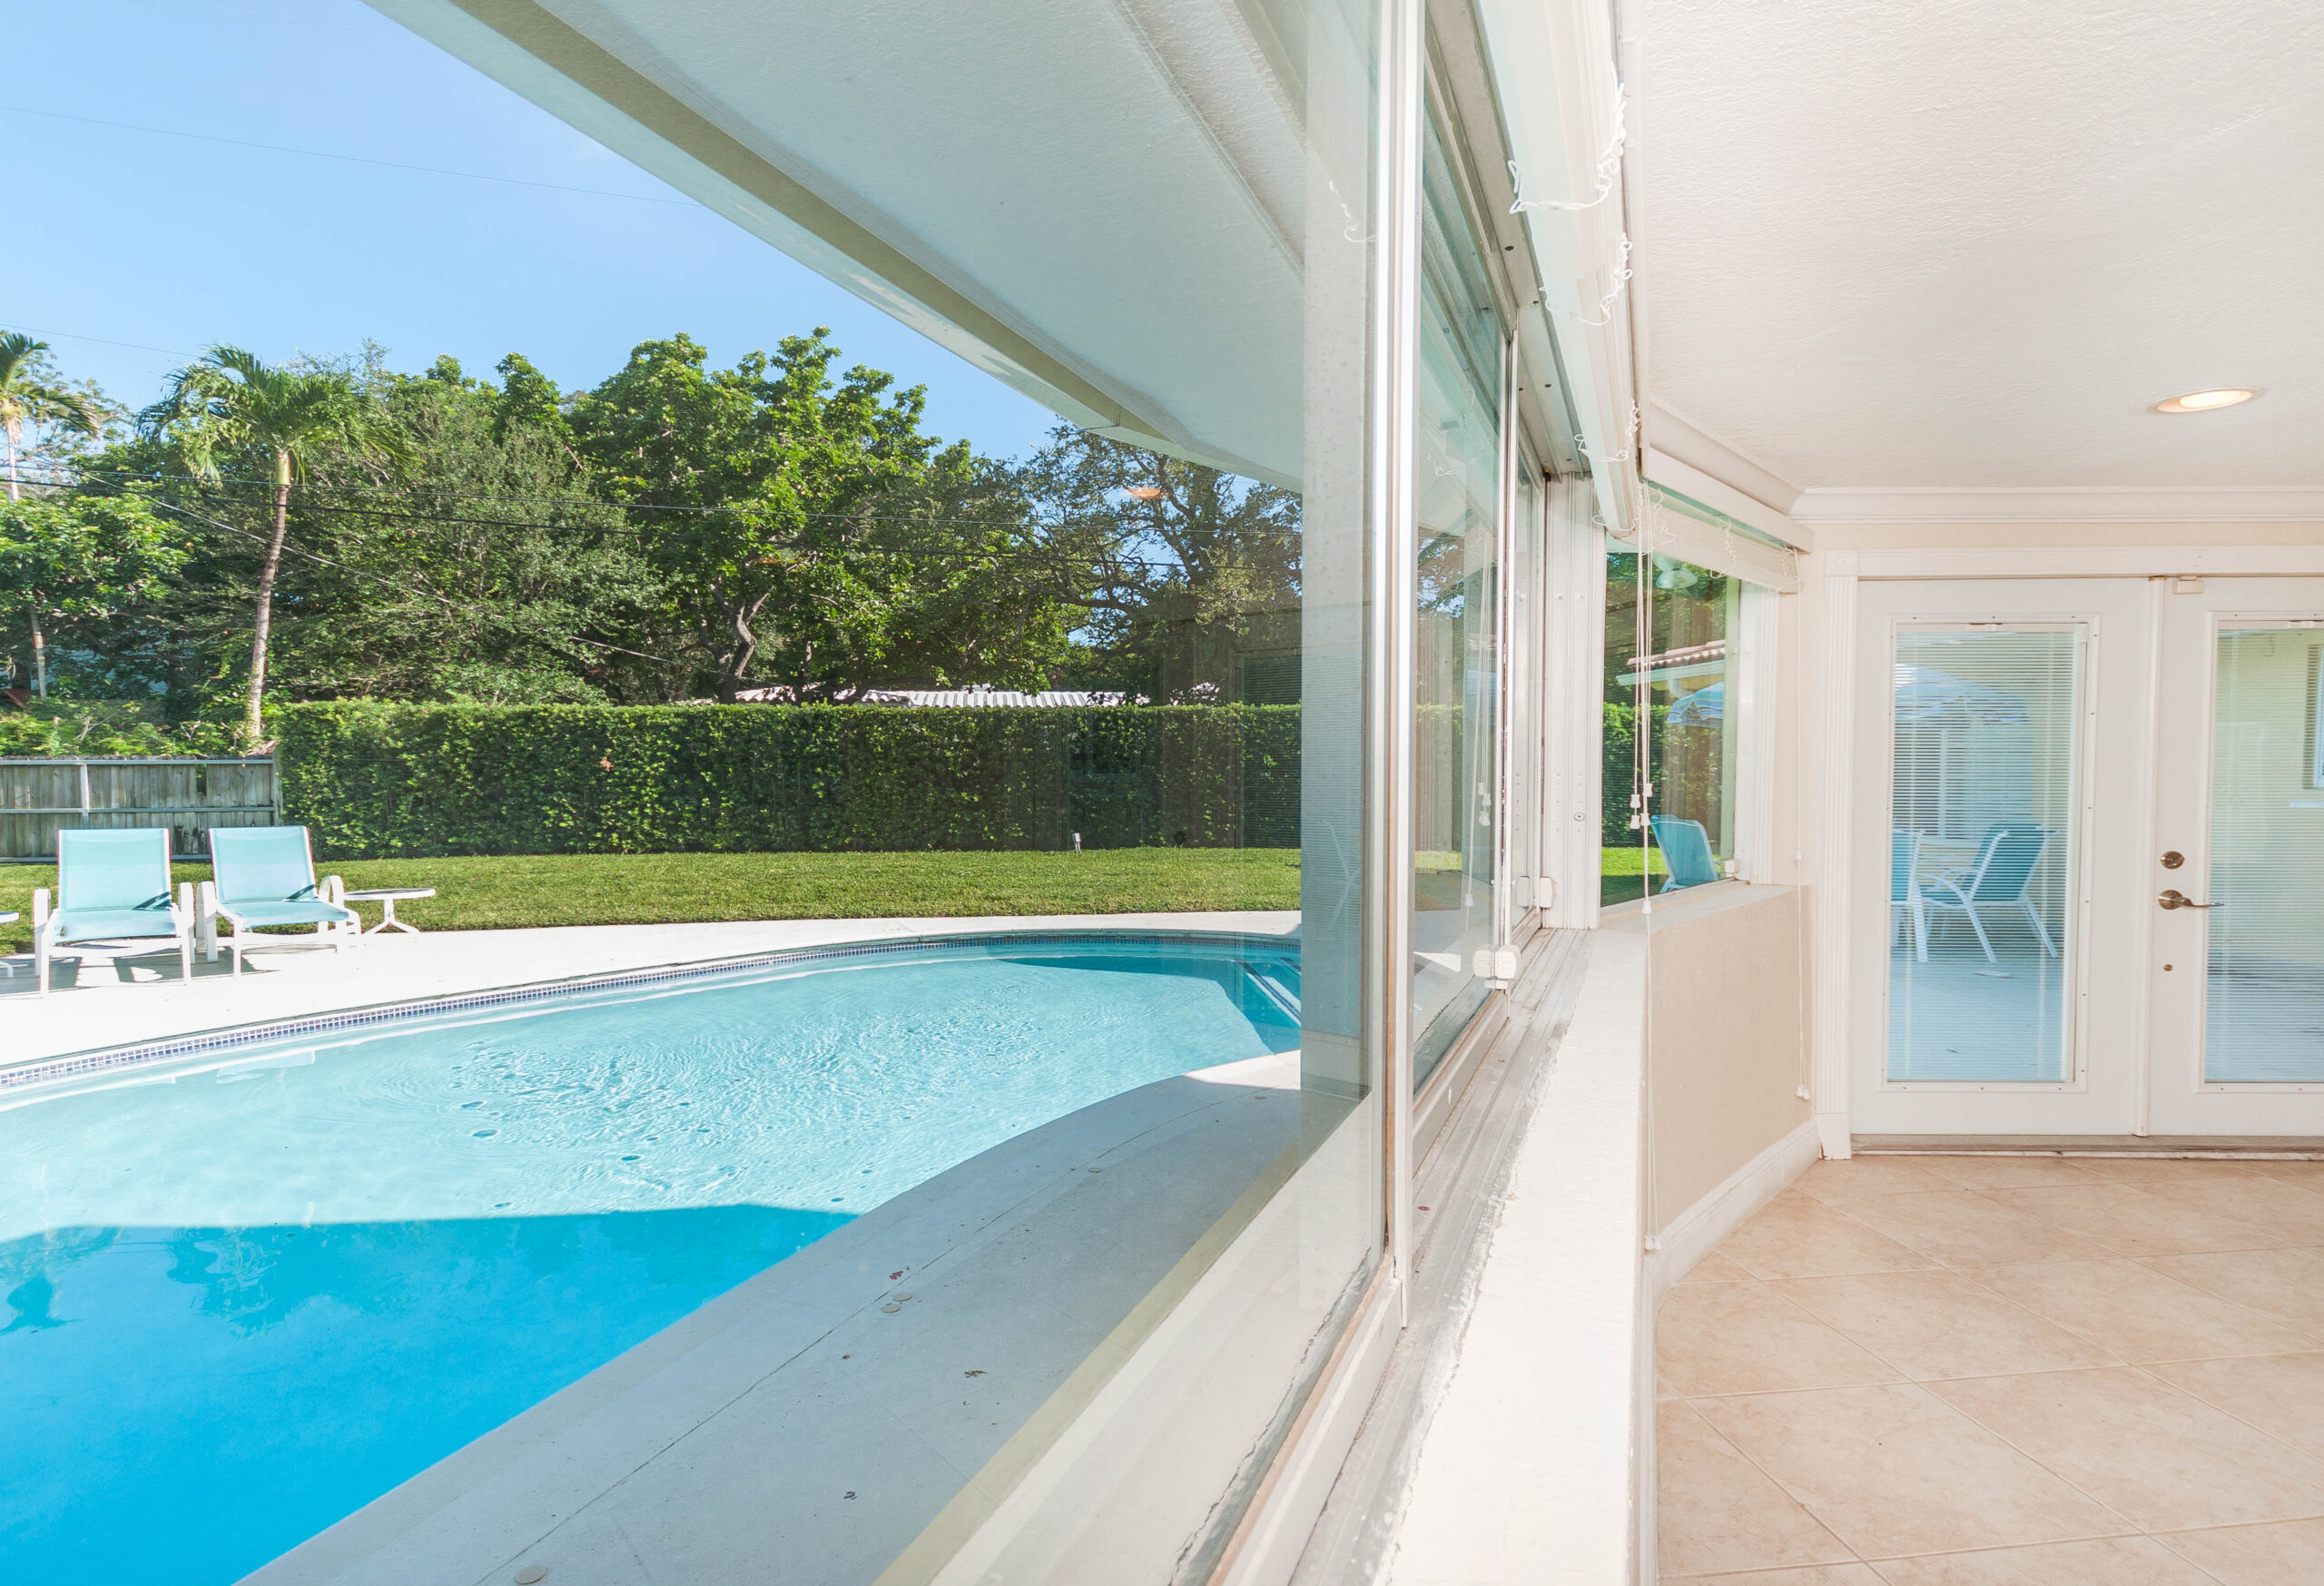
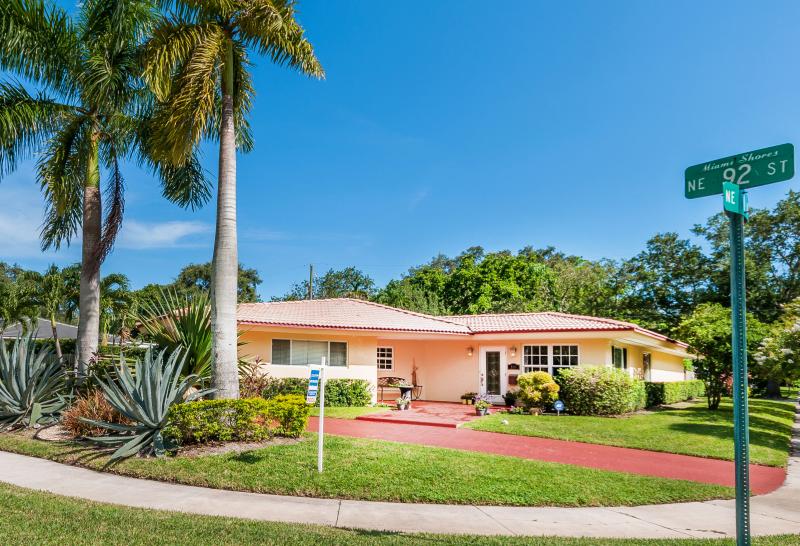
Miami Shores House of The Month
The Miamism Sales Team recommends the mid-century home located at 100 NE 92 St. Here we have a home with a nice, neutral palette in good condition, great bones, with amazing potential. Finishes are vanilla, but it’s priced with updating and remodeling in mind at $284/SF. The beauty of this home is its 13,000 SF lot!! It epitomizes the Miami Shores organic home with plenty of room to grow and expand as a family’s needs grow and expand. It has 3 bedrooms and 3 bathrooms, split-bedrooms plan, pool, gas, built-ins, and actual laundry room.
It’s offered at $648,800 ($284/SF)
Please contact us for additional information and to schedule a private showing appointment.