How is The Miami Shores Market Doing? Compared to a year ago?
THE MARKET IS NOT GOING DOWN AND WE ARE NOT SEEING A DECREASE IN PRICING!!
Please note that you are getting a skewed perspective of sales because sellers are reducing pricing from already elevated numbers. You need to compare data of closed sales, not homes on the market to know that prices are still increasing. If you want to know more, contact us!! The numbers don’t lie!!
There are currently 65 homes for sale: (compared to 25 a year ago in October)
- Highest priced listing is $10.995 Million for the bay front home at 9767 NE 13th Ave. This 5 bedroom / 4.5 bathroom home has 5,094 Sq.Ft., a 28,047 Sq.Ft. lot and 187′ of open bay water frontage. It was purchased for $7.495M back in April of 2021 and it’s not listed again for $3.5 Million more
- Lowest priced listing is $550,000 for the 2/2 at 395 NW 111th Ter (new Miami Shores Estates subdivision by Barry University) – listed for $442/Sq.Ft.
- Pending Sales (properties under contract): 12 (compared to 36 a year ago)
- Median Sales Price in October: $1.2 Million (compared to $875,000 a year ago)
- Closed sales in October: 11 (compared to 16 in October of 2021)
What is the average price per square foot in Miami Shores?
The average sold price per square foot in Miami Shores in October for homes not on the water was $602 compared to $492 a year ago!
- September’s average $658
- August’s average $608
- July’s average $625
- June 2022’s average $625
- May 2022’s average $649
- April 2022’s average $689
- March 2022’s average $528
- February 2022’s average $540
- January 2022’s average $622
- 2021’s average of $431
The average sold price per square foot in Miami Shores in October for homes ON the water was $624 (only one sale and not navigable) compared to no waterfront sales in October of 2021. Past month averages as follows:
- September’s average $751 (one sale)
- August’s average $1,409
- July’s average $559 (one sale)
- June’s average $839 (one sale)
- May’s average $1,471
- April’s average $1,123
- March’s average – no sales
- February’s average – no sales
- January’s average – no sales
Miami Shores Real Estate Micro-Stats
Feel free to download our complete market report for the last 12 months, showing micro-stats for Houses for Sale Miami Shores

- Seller’s Market with 3 months of inventory
- Price-range moving the most is between $1-1.5 Million
- Average sold price is $1.2 Million
- 50% of all deals are CASH
- 86.8% of all buyers do so as primary residents (homestead and live in their homes)
DOWNLOAD MIAMI SHORES 3D MARKET REPORT
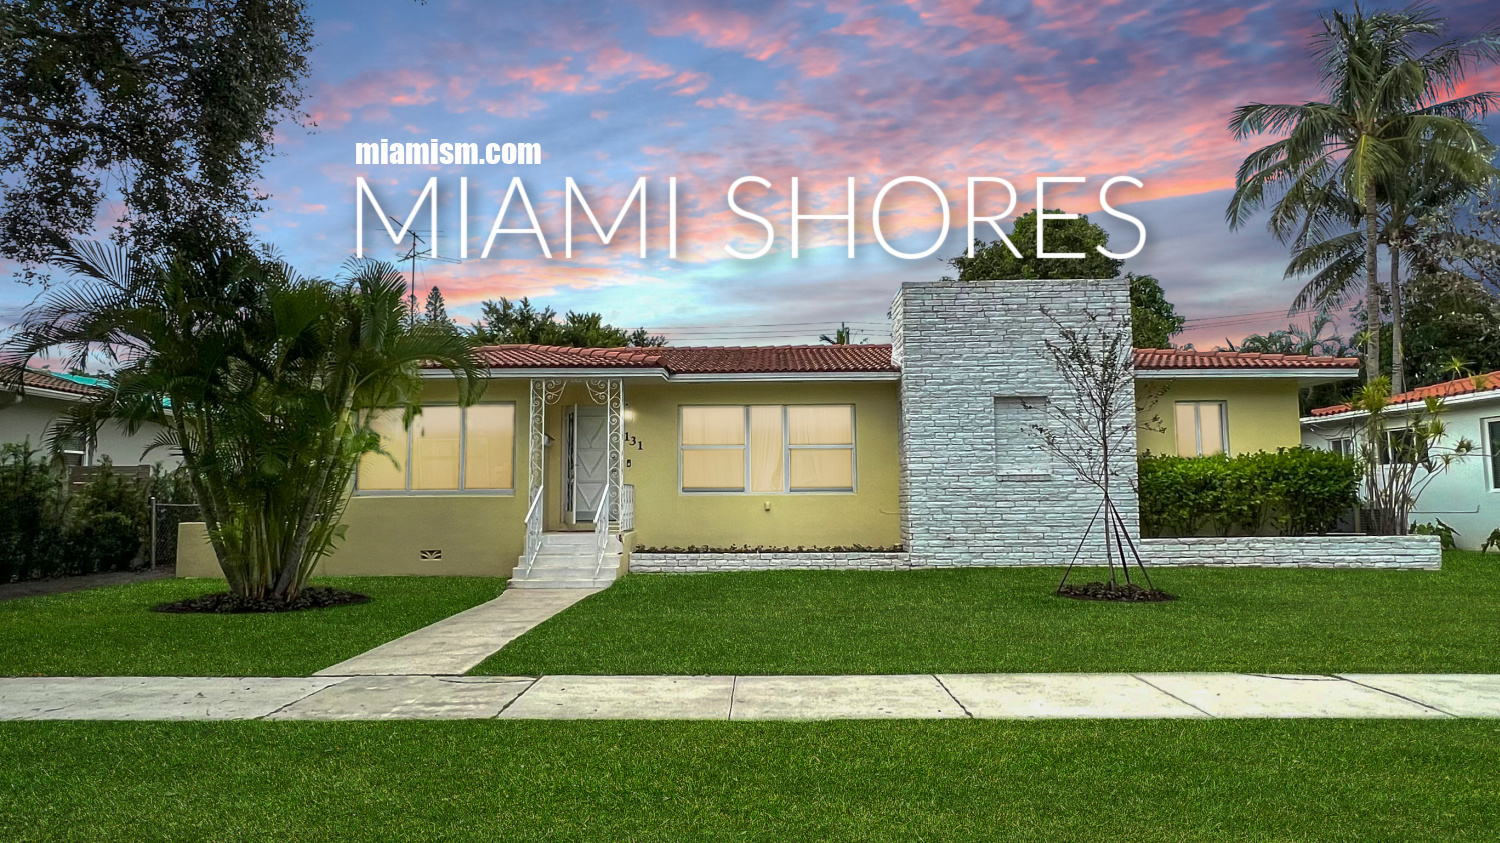
Miami Shores New Listing

We have a NEW LISTING in the Downtown Miami Shores Area and it’s priced at $530/Sq.Ft. below the average price per square foot for non-waterfront homes (Which is $566)!!
West of NE 2nd Avenue in quiet, tree-lined street.
131 NE 96th St – Miami Shores, FL 33138
This is a 3 bedroom / 3 bathroom home with converted garage and 1,869 Sq.Ft. of living space. This 50’s home sits on a 8,625 Sq. Ft. lot has a renovated kitchen, impact windows and in great condition – ready for someone to move in or remodel.
Big ticket items are done and the home only needs aesthetic work: refinish hardwood floors, 2 bathrooms and privacy landscaping.
$990,000

