There are currently 55 Surfside homes for sale: (compared to 51 in May)
- Highest priced listing: $5,000,000 (1332 Biscaya Dr – see below)
- Lowest priced listing: $565,000 (9156 Harding Ave – see below)
- Pending Sales: 1(compared to 4 in May)
- Closed Sales in June: 6 (same as in May)
- Median Sales Price in May: $762,000
The 6 Surfside homes sold in June were the following:
- 9181 Carlyle Ave – 2 bedrooms / 1 bathroom with 1,099 SF on 5,600 SF lot. Fixer upper originally listed for $599,000 as a development opportunity in January 2017, with several price reductions and finally selling for $505,000 ($460/SF)
- 9240 Abbott Ave – 3 bedrooms / 3 bathrooms with 1,976 SF on 5,600 SF lot. Listed for $675,000 in January 2017 and selling for $600,000 ($332/SF)
- 9133 Garland Ave – 3 bedrooms / 2 bathrooms with 2,131 SF on 5,600 SF lot. Listed for $750,000 in March and selling for $745,000 ($445/SF)
- 8958 Abbott Ave – 3 bedrooms / 2 bathrooms with 2,200 SF on 5,600 SF lot. Originally listed in September of 2016 for $790,000 and selling for $770,000 ($350/SF)
- 9464 Carlyle Ave – 3 bedrooms / 3 bathrooms with 2,139 SF on 5,600 SF lot. Originally listed in November of 2016 for $855,000 and selling for $785,000 ($404/SF)
- 700 95 St – waterfront home with 4 bedrooms / 3.5 bathrooms with 3,332 SF on 10,010 SF lot with 55′ of water frontage. Listed for $3,300,000 in July of 2016 and selling for $2,050,000 ($615/SF)
The average selling price per square foot for Surfside homes not on the water in June was $398, compared to previous months:
- $355/SF in May
- $387/SF in April
- $423/SF in March
- $423/SF in February
- $363/SF in January
- 2016’s average of $377/SF.
There was only one waterfront home sold in June – 700 95 St and that sold for $615/SF.
Because we have hit the mid point of 2017, it’s good to look at the year’s stats as well. Remember that appraisers will look 3 months back and 6 months back. To really scrutinize a market, you need to look at at least 6 months of movement to make a fair assessment of the market.
With that said – the average price per square foot for Surfside homes NOT on the water for the first half of 2017 is $396 (compared to 2016’s average of $377) – It’s important to see an upward trend which shows a gradual instead of a drastic change.
The average price per square foot for Surfside home on the water for the first half of 2017 is $599. (but only a total of 3 homes sold)
We are seeing a gradual increase in price per square foot not only on a monthly basis, but for the first half of the year. Inventory continues to be low and demand remains the same. Surfside continues to be one of the strong single-family real estate markets in South Florida.
Because national and county-wide news sources can be slow and not accurately represent what is happening in your local market, we recommend signing up to our localized, easy to read real-time market reports that provide you with a well-rounded, up to date view of how the real estate market is behaving. Please CLICK HERE for Surfside reports or visit MiamismTRENDS.com for other areas.
Contact us for a no-obligation consultation to give you an idea what your home could sell for. It’s key to know the right market timing to get the right price for your home.
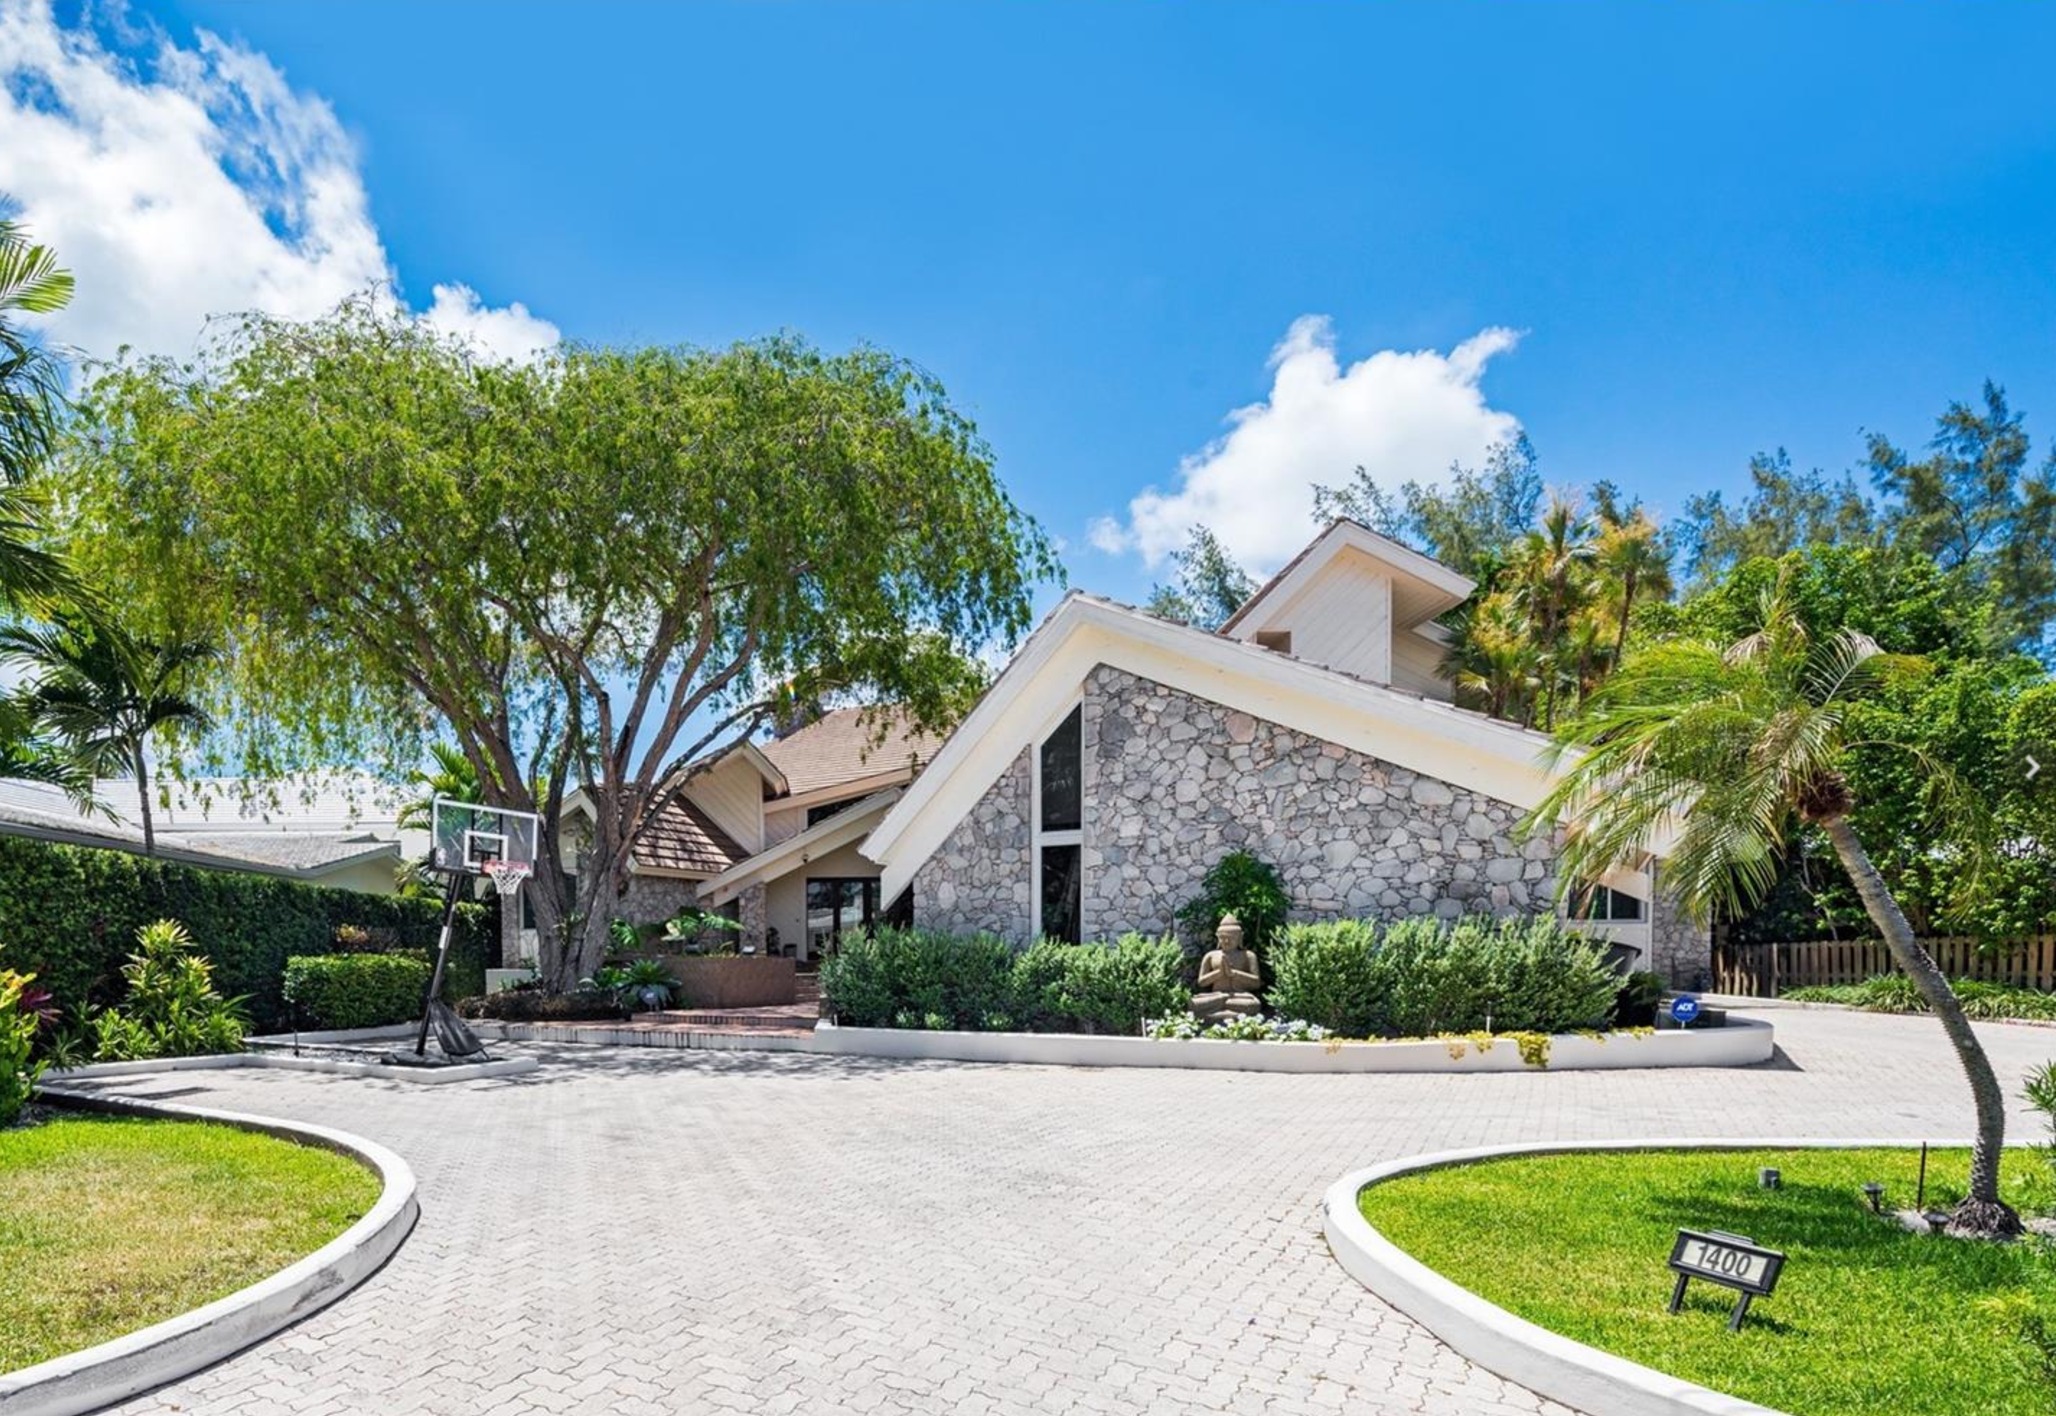
Surfside Home of The Month
This month, The Miamism Sales Team recommends an epic Barry Sugarman designed home from the 80’s. Huge 6,661 SF waterfront home with 18,400 SF lot with 92′ of water frontage facing Indian Creek Island and bay. The home in located at 1400 Biscaya Dr and has 4 bedrooms, 6.5 bathrooms and crazy roof lines and textures Sugarman became known for. Don’t miss the interior photos below.
The home is being offered for $4,995,000 ($750/SF)
Please contact us for additional information or to schedule a showing appointment for this and any other Surfside home.