Surfside Real Estate Market Report – November 2019
How is the Surfside Real Estate Market Doing?
There are currently 51 Surfside homes for sale: (compared to 47 last month)
-
Highest priced listing: $5,250,000 for the waterfront home at Biscaya Island, located at 1413 Biscaya Dr with 6 bedrooms / 6.5 bathrooms, 6,072 SF on 10,709 SF lot with 68′ of water frontage.
-
Lowest priced listing: $550,000 for the small, 2/1 home, being sold as development opportunity with 2 adjacent lots also available for sale.
-
Pending Sales: 13
-
Closed Sales in November: 4 (compared to 6 in October)
-
Median Sales Price in November: $720,500

The 4 Surfside homes sold in November were the following:
- 9181 Byron Ave – completely remodeled 3 bedrooms / 2 bathrooms, 1,984 SF on 5,600 SF lot. Originally listed in January of 2017 for $925,000. Property was on and off the market, had several price reductions and increases and sold for $900,000 ($493/SF)
- 9472 Carlyle Ave – updated 3 bedrooms / 3 bathrooms, 1,761 SF on 5,600 SF lot. Listed for $827,000 in May and selling for $770,000 ($437/SF)
- 9049 Dickens Ave – 1952 in good condition with 3 bedrooms / 2 bathrooms, 1,823 SF on 5,600 SF lot. This home was purchased for $571,000 in June of 2018, was fixed up a bit and relisted for $719,000 in May of 2019 and sold for $671,000 ($368/SF)
- 9381 Carlyle Ave – nice 50’s house with 2 bedrooms / 2.5 bathrooms, 1,766 SF on 5,600 SF lot. Originally listed for $679,900 in December of 2018, had several price reductions and closed for $580,000 ($372/SF)
The average price per square foot in November for Surfside homes not on the water was $418, compared to previous months:
- October average $369
- September average $433
- August average $385
- July’s average $380
- June’s average $391
- May’s average $446
- April’s average $337
- March’s average $410
- February’s average $352 (1 sale)
- January’s average **no sales
- 2018’s average $360
There were no waterfront sales in the month of November in Surfside and therefore, no average. The average price per square foot in previous months was:
- October average **no sales
- September average **no sales
- August average **no sales
- July’s average **no sales
- June’s average **no sales
- May’s average $852 (one sale)
- April’s average $756 (one sale)
- March’s average **no sales
- February’s average $598
- January’s average $690

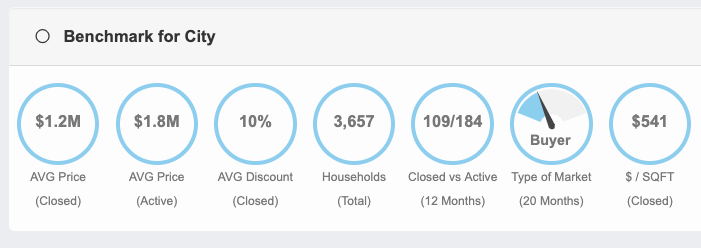
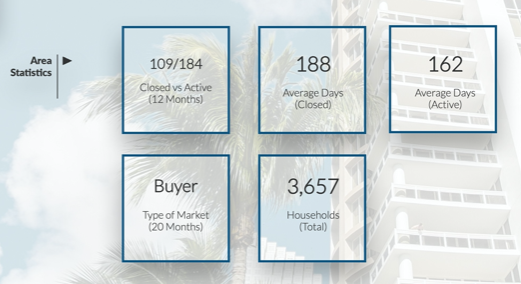
Surfside’s inventory of homes continues to increase and we now have 20 months of inventory. (It will take 20 months to sell listed homes at the current rate of sales).
There’s an average discount rate of 10% in Surfside and 63% of transactions are done with conventional loans. 54% of buyers are investors. Our new market reports offer micro-data that is crucial in identifying the right time to buy or sell and what your personal strategy will be.
Our new reports, which you can DOWNLOAD HERE, use the last 12 months of data, for you to make an educated decision about buying or selling.
Please contact us when you are ready to buy and sell in Surfside – click here for a complimentary evaluation of your home.
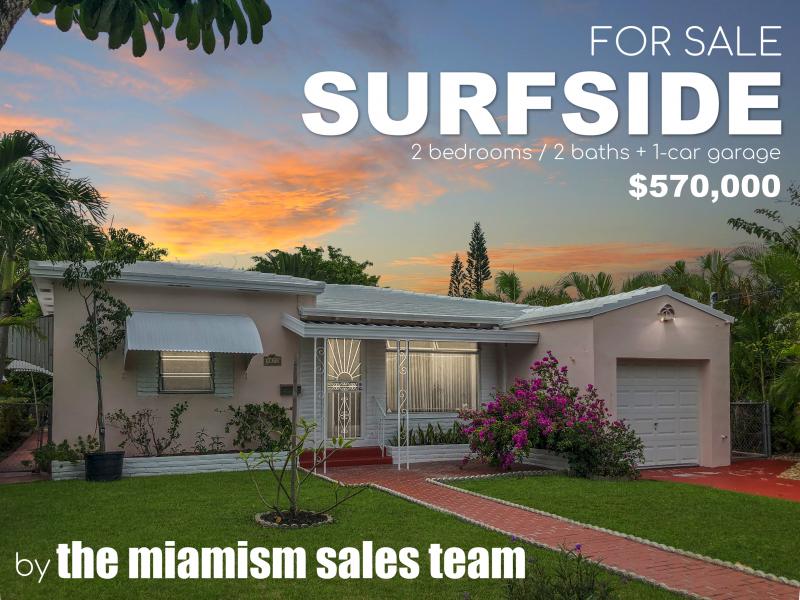
Featured Surfside Home For Sale

9072 Dickens Ave – Surfside, FL
This is a property in need of updates but in good condition, perfect for an investor or someone looking to remodel. The home has 2 bedrooms / 2 bathrooms plus a 1-car garage. The home’s square footage is 1,691 and sits on a 5,607 SF lot and was built in 1946. Please contact us for additional information.
