Keystone Point Real Estate – November 2022 – monthly market report
Welcome to our Keystone Point Real Estate monthly market report – we publish these the third week of the month, so come back to see how the market is doing and how it compares to the past year.
THE MARKET IS NOT GOING DOWN AND WE ARE NOT SEEING A DECREASE IN PRICING!!
Please note that you are getting a skewed perspective of sales because sellers are reducing pricing from already elevated numbers. You need to compare data of closed sales, not homes on the market to know that prices are still increasing. If you want to know more, contact us!! The numbers don’t lie!!
Here are some truths:
- rising mortgage rates have decreased buyer pool (meaning buyer demand has come down and buyers can afford less than a year ago)
- inventory has increased at a moderate level but not enough to affect home prices
- Home prices have NOT decreased, on the contrary, continue to increase but at moderate levels
- Sellers are being more flexible (when it comes to financing and appraisal contingencies, not pricing)
How is the Keystone Point Real Estate Market Doing?
There are currently 22 homes for sale (compared to 14 a year ago):
- Highest priced listing $6,252,740 for the new construction at 1925 N Hibiscus Dr with 6 bedroom / 5.5 bathroom, 6,173 Sq.Ft on 8,475 Sq.Ft. lot with 75′ of water frontage ($1,013/Sq.Ft.)
- Lowest priced listing
$1,250,000$1,200,000 for the 3/2 dry-lot home (non-waterfront) located at 1965 Alamanda Dr ($737/Sq.Ft.) - Pending Sales (Properties under contract): 3
- Median Sales Price in November: $2,500,000 (compared to $1,351,000 in November of 2021)
- Closed Sales in November: 2 (compared to 6 sold in November 2021)
What is the average price per square foot in Keystone Point?
The average sold price per square foot in Keystone Point in September for homes on the water was $1,172 compared to $529 in November of 2021.
- October’s average $807
- September’s average $1,065
- August’s average $1,190
- July’s average $1,253
- June’s average $1,350
- May’s average $1,189
- April’s average $855
- March’s average $1,076
- February’s average $1,066
- January’s average $755
- 2021’s average of $700/SF
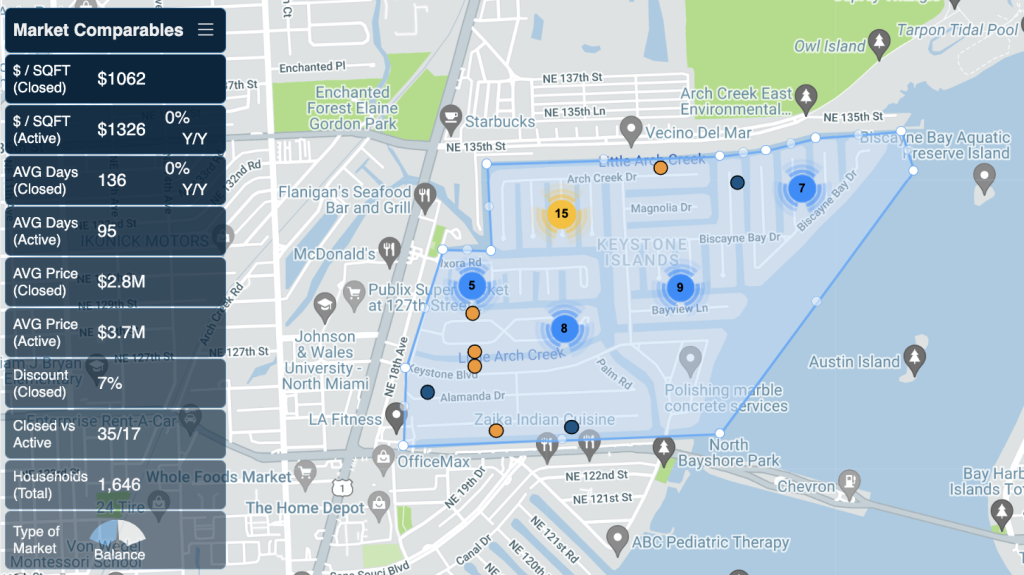
Keystone Point Real Estate Micro-Stats
Feel free to download our complete market report for the last 12 months, showing micro-stats for Real Estate Keystone Point.

- Balanced market with 6 months of inventory (market doesn’t favor either buyers nor sellers)
- Average sales price is $2.8 Million
- Price-range moving the most is above $2 Million
- All buyers are domestic
- 74.3% of all buyers are primary residents (homestead and live in their homes)
