Miami Shores Real Estate Market Report – May 2020
How is the Miami Shores Real Estate Market Doing?
There are currently 92 homes for sale: (compared to 102 last month)
- Highest priced listing is
$3,975,000$3,500,000 for the perfectly remodeled home at 1460 NE 103 St. (not quite bay front, but second home in from the bay) with 4 bedrooms / 4.5 bathrooms, 3,750 SF on 17,945 SF lot with 122′ of water frontage.
- Lowest priced listing is $324,000 for the 2/1 fixer upper located at 19 NW 109th St.
- Pending Sales (Properties under contract): 30
- Median Sales Price in May: $565,000
- Closed sales in May: 9 (Compared to 12 in April)
DOWNLOAD 3D MARKET ANALYZER REPORT HERE
What sold in Miami Shores in May?
The 9 homes sold in Miami Shores in May were the following:
- 68 NW 92 St – 2 bedrooms / 1 bathroom home with 1,222 SF on 7,680 SF lot. Listed for $405,000 in November of 2019 and sold for $380,000 ($343/SF)
- 549 NE 106 St – 3 bedrooms / 2 bathrooms with 1,691 SF on 9,150 SF lot. Listed for $495,000 in March of 2020, cancelled and relisted for $500,000 in May and sold for 485,000 ($316/SF) **cash transaction
- 129 NW 97 St – 3 bedrooms / 2 bathrooms with 1,939 SF on 7,725 SF lot. Listed for $569,000 in January, MLS shows a contract that fell through, it was then decreased a few times and closed for $518,000 ($267/SF)
- 906 NE 98 St – 2 bedrooms / 2.5 bathrooms with 1,724 SF on 11,300 SF lot. Listed for $599,000 in February and closed for $565,000 ($328/SF)
- 112 NE 111 St – 3 bedrooms / 2 bathrooms with 1,836 SF on 9,225 SF lot. Listed for $625,000 in December 2010, had 1 price reduction and sold for $575,000 ($408/SF)
- 383 NE 97 St – 4 bedrooms / 3.5 bathrooms with 2,553 SF on 8,625 SF lot. Listed for $619,000 in March and sold for $597,500 ($258/SF)
- 499 NE 102 St – 3 bedrooms / 2 bathrooms with 1,935 SF on 9,351 SF lot. Listed for $675,000 in December, shows a contract that fell through in the MLS and closed for $645,000 ($383/SF)
- 10515 NE 3rd Ave – 4 bedrooms / 3 bathrooms with 2,119 SF on 14,375 SF lot. Originally listed for $877,777 in April of 2018, had several price reductions and listing expired in May of 2019. It was relisted in March of 2020 for $785,000 and sold for $750,000 ($354/SF)
- 10151 NE 14th Ave – remodeled east of the boulevard home with 3 bedrooms / 3 bathrooms, 2,118 SF on 10,925 SF lot. Originally listed for $1,145,000 in April of 2019, had several price reductions, shows a deal that fell through and final sale of $925,000 ($437/SF)
DOWNLOAD 3D MARKET ANALYZER REPORT HERE
What is the average price per square foot in Miami Shores?
The average sold price per square foot in Miami Shores in May for homes not on the water was $344 compared to:
- April’s average $349
- March’s average $320
- February’s average $378
- January’s average $276
- 2019’s average of $324.
- 2018’s average of $317.
There were no waterfront homes sold in May in Miami Shores.
- April average – no sales
- March average – no sales
- February average – no sales
- January average – no sales
DOWNLOAD 3D MARKET ANALYZER REPORT HERE
Miami Shores Opinion

Just as expected, with an increase in demand and a drop of inventory, we now have a balanced market with 6 months of inventory. That captive buyer audience that is online waiting for COVID19 to shift, is now coming out strong, ready to make a purchase. Those homes that are priced correctly are the ones selling, so make sure you consult with a professional that knows the market well, with micro-data and can identify condition, location and desirability of your home.
Let’s keep a close eye on inventory since that will determine if prices start increasing or stay the same.

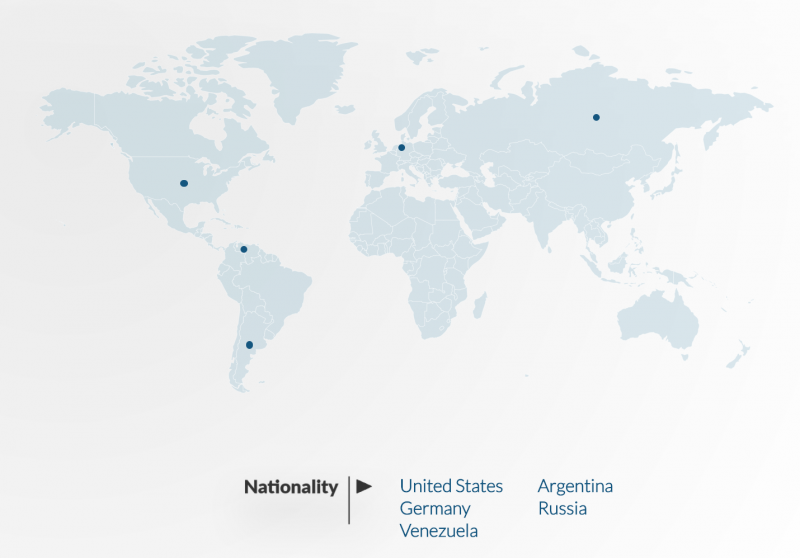
It’s also super important to identify buyers in the area and their profile in order to maximize the value of your home. Our market reports are so thorough that we not only interpret Demographic data, but we put it into action when we market homes in order to find the right buyer. Take a look at countries buying in Miami Shores: Germany, Venezuela, Argentina and Russia. Also note that 24.4% of buyers are either second home buyers or investors and 25.5% of all sales are cash transactions.

Remember that serious buyers are out there right now and we are being more thorough about pre-qualifying anyone that wants to see properties for ours and your safety.
To ge a copy of our 3D-market analyzer report, please click HERE or contact us with your address and we’ll be happy to provide a physical copy.
