Surfside Real Estate Market Report for 2019
Talk about a bumpy ride for Surfside but we are happy to report that the market seems to be back on track. It’s common to see neighborhoods with fast appreciation to come to a complete halt and even regress a bit to past years. 2019 proves that Surfside is back on track but keep in mind that appreciation will be very conservative.
The highest sale right now is for a Max Strang designed, bay front home at 1276 Biscaya Drive, listed for $6,295,000. This home was listed in December and is definitely a one-of-a-kind property.
The lowest listing is for the property at 8712 Byron Ave, being sold since October 2018 as a “development opportunity” with 2 adjacent lots also available, for $550,000.
Out of the 48 homes in Surfside sold in 2019, only 7 were waterfront, and those selling at an average square foot of $690 and ranging between $449/SF and $856/SF.
Let’s start by taking a look at price per square foot changes for non-waterfront homes in Surfside.
Download our latest 3-D Market Analyzer HERE.
Surfside Homes – Price per Square Foot
Here is a list with average price per square foot in the past years for Surfside homes not on the water:
| Year | Price per SF |
|---|---|
| 2019 | $386/SF |
| 2018 | $360/SF |
| 2017 | $382/SF |
| 2016 | $377/SF |
| 2015 | $350/SF |
| 2014 | $324/SF |
| 2013 | $270/SF |
| 2012 | $233/SF |
| 2011 | $193/SF |
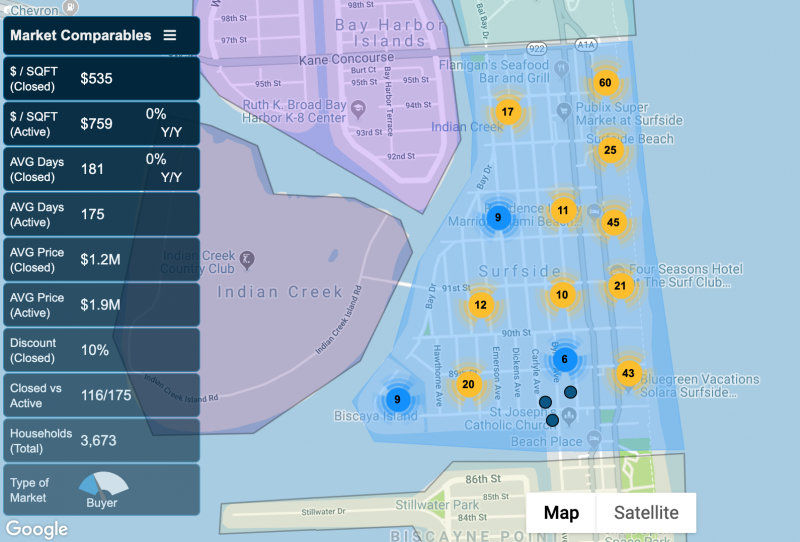
Surfside is now back on track – after seeing massive increases, 2018 proved to be a challenging year and now expect appreciation to remain at a conservative pace. It is still a buyer’s market with 12 months of inventory – this means that at the current pace of sales, it would take 12 months for current inventory to sell.

What is interesting to note, at a micro level, from Surfside’s sold data in 2019, is that 3 bedroom homes sold for a higher price per square foot ($393/SF average), than 4 bedroom homes ($346/average). 2-bedroom homes had an average discount of 11% in Surfside and most sales happened between $500,000 and $700,000. That’s what we call Surfside’s “sweet spot”.
We offer market reports on a monthly basis for you to stay on top of the pulse of the market. These reports help you identify the best time to buy or sell. Download our latest 3-D Market Analyzer HERE.
Surfside Real Estate Market Report for 2019

The general figures for Surfside homes in 2019 are the following: (click HERE to see 2018 figures)
- There were 48 Surfside homes sold in 2019. The median sales price was $745,000.
- The highest sale in Surfside in 2019 was for the waterfront home at 9056 824 88th Street. This home was originally listed for $4,425,000 in August of 2018 and sold for $3.9 Million in January of 2019.
- The highest non-waterfront home sale in Surfside in 2019 was for the completely renovated home at 9540 Byron Ave with 5 bedrooms / 4.5 bathrooms, 3,019 SF of living space and 9,677 SF lot.
- The lowest Surfside home sold in 2019 was located at 8838 Harding Avenue with rentable in-law quarters. This home was originally listed for $599,000, reduced several times and sold at $500,000 in October of 2019.
- The highest average price per square foot in Surfside for a non-waterfront home was $617, for the beautifully remodeled home at 8810 Froude Ave with 3 bedrooms / 2.5 bathrooms, 1,693 SF of living area on 5,600 SF lot. This home was listed for $1,195,000 in December of 2018 and sold for $1,045,000 in May of 2019.
- There was only 1 sale under $500,000 in 2019.
Download our latest 3-D Market Analyzer HERE.
List of Surfside Homes Sold in 2019

To get a list of all Surfside homes sold in 2019, please contact us.
Download our latest 3-D Market Analyzer HERE.
