2021 was a record breaking year for Surfside Real Estate as well as many other markets across South Florida and the rest of the nation. Prices are still soaring because of persistent lack of inventory as well as high buyer demand.
2021 will remain forever in our hearts because of the building collapse trategy that shook up not just the Surfside community, but the whole world. There are many changes happening to the building and real estate industry because of the devastation which at least give some sort of consolation.
After Surfside: What Should You Know about your Condo?
As far as the future of the real estate market – although interest rates are expected to rise and inventory also expected to improve, it will not be enough to satisfy the high demand. We expect prices to continue to rise. No matter if you are a buyer or seller in this market, you need to be ready, you need to strategize and you need to work with the right real estate team.
Without further ado, here are this year’s stats.
Surfside Homes – Price per Square Foot
Here is a list with average price per square foot in the past years for Surfside homes not on the water:
| Year | Price per SF |
|---|---|
| 2021 | $502/SF |
| 2020 | $416/SF |
| 2019 | $386/SF |
| 2018 | $360/SF |
| 2017 | $382/SF |
| 2016 | $377/SF |
| 2015 | $350/SF |
| 2014 | $324/SF |
| 2013 | $270/SF |
| 2012 | $233/SF |
| 2011 | $193/SF |
Please pay attention in the increase In price per square foot between 2020 and 2021 – we’re talking almost $100, which is unheard of in the history of Surfside real estate. To think that in 10 years, it has almost trippled is a good testament for the value of Surfside Real Estate, especially if you are hesitant about buying in such a hot seller’s market.
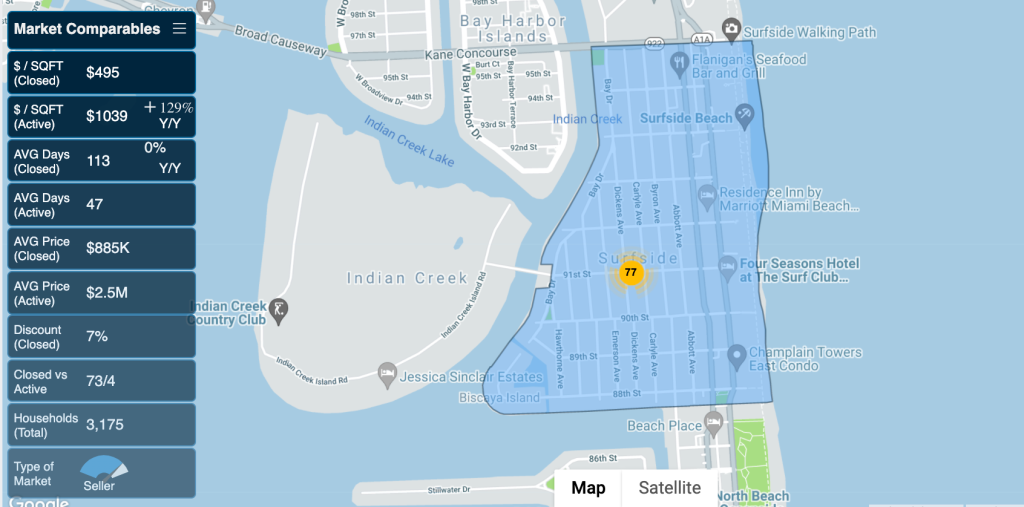
Take a look at the benchmark for Surfside homes in the last 12 months:

Some interesting stats from 2021 is that 63.8% of transaction were CASH transactions, compared to 40.4% in 2020. 67% of all purchases were for primary residences and although most buyers were local and from other parts of the U.S., 19% were foreign nationals coming from Canada, Argentina, France and Russia.
We offer market reports on a monthly basis for you to stay on top of the pulse of the market (2nd week of every month). These reports help you identify the best time to buy or sell.
Download our latest 3-D Market Analyzer HERE.
Surfside Real Estate Market Report for 2021
The general figures for Surfside homes in 2021 are the following: (click HERE to see 2020 figures)
- There were 87 Surfside homes sold in 2021, compared to 62 sold in 2020. The median sales price was $875,000 compared to $740,000 in 2020.
- The highest sale in Surfside in 2021 was for the waterfront home on the inside of Biscaya island at 1413 Biscaya Dr. This new construction, modern home sold in January of 2020 for $4.75 Million, was relisted in August of 2021 for $10.75 Million and sold for $10 Million in December of 2021. ($1,848/Sq.Ft) **cash transaction
- The highest non-waterfront home sale in Surfside in 2021 was for the 2019 new construction at 901 88th Street which was listed for $1.9 Million in october of 2020 and sold for $1.9 Million in June. ($619/Sq.Ft) **cash transaction
- The lowest priced Surfside home sold in 2021 was located at 8943 Hawthorne Ave. Complete fixer upper with a pool, listed for $530,000 and selling for $550,000 ($473/Sq.Ft)
- The lowest Surfside home per square foot was the home located at 9073 Dickens Ave. Outdated home but in good condition originally listed for $799,000, showing several contracts that fell through, relisted for $849,000, lowered a few times and finally selling for $805,000 ($233/Sq.Ft) **cash transaction
- There were no sales under $500,000 in 2021.
Download our latest 3-D Market Analyzer HERE.
List of Surfside Homes Sold in 2021
To get a list of all Surfside homes sold in 2021 please contact us.