Surfside Real Estate Market Report – June 2020
How is the Surfside Real Estate Market Doing?
There are currently 42 Surfside homes for sale (compared to 59 last month):
-
Highest priced listing: $6,000,000 for the modern home with 5 bedrooms / 4.5 bathrooms, 6,266 SF on 10,050 SF lot with 50′ of water frontage, built in 2016 ($958/SF)
-
Lowest priced listing: $505,000 for the 1926 home located at 8918 Harding with 3 bedrooms / 2 bathrooms, 1,460 SF on 5,600 SF lot. ($346/SF)
-
Pending Sales: 12 (homes with a sales contract that have not yet closed)
-
Closed Sales in June: 5 (compared to 1 in May)
-
Median Sales Price in June: $585,000
DOWNLOAD SURFSIDE MARKET REPORT
Surfside Home Sales in June
The Surfside homes sold in June were the following:
- 9172 Harding Ave – 4 bedrooms / 4 bathrooms, 1,773 SF on 5,600 SF lot. Property was originally listed for $775,000 in July of 2017, shows as cancelled, relisted and reduced several times. Last price reduction was in February 2020 to $537,000 and sold for $520,000 ($337/SF)
- 9024 Byron Ave – 2 bedrooms / 2 bathrooms, 1,706 SF on 5,600 SF lot. Listed for $570,000 in January and sold for $542,000 ($359/SF) **cash transaction
- 9417 Carlyle Ave – 2 bedrooms / 2 bathrooms, 1,216 SF on 5,600 SF lot. Listed for $648,000 in February, MLS shows a contract that fell through, it was reduced to $599,000 and sold for $585,000 ($481/SF)
- 9317 Abbott Ave – 3 bedrooms / 2 bathrooms, 1,745 SF on 5,600 SF lot. Listed for $825,000 in May and sold for $820,000 ($470/SF)
- 724 90th St – 3 bedrooms / 3 bathrooms, 2,846 SF on 12,460 SF lot. Originally listed for $1,395,000 in April of 2018, expired and was relisted for $1,395,000 in December 2018, then again for $1,299,000 in November 2019 and sold for $1,129,500 ($397/SF) **cash transaction
DOWNLOAD SURFSIDE MARKET REPORT
Surfside Price per Square Foot
The average price per square foot in June for Surfside homes not on the water was $409, compared to previous months:
- May’s average $528 (one sale)
- April’s average $508
- March’s average $354 (one sale)
- February’s average $382 (one sale)
- January’s average $328
- 2019’s average $386
- 2018’s average $360
There were no waterfront sales in the month of June in Surfside, compared to previous months:
- May’s average **no sales
- April’s average **no sales
- March’s average **no sales
- February’s average **no sales
- January’s average $782 (one sale)
DOWNLOAD SURFSIDE MARKET REPORT
Surfside Real Estate Stats

Surfside is evidencing a decrease in inventory and increase in demand, like most of the rest of Miami. Although general stats seem unchanged, we should see a decrease in absorption rate in the next couple of months which will show more of a balanced market instead of a buyer’s market.
Simple law of economics show that less inventory and more demand should start leveling off the market a bit – we’ll keep a close eye and will continue reporting on the second week of every month.

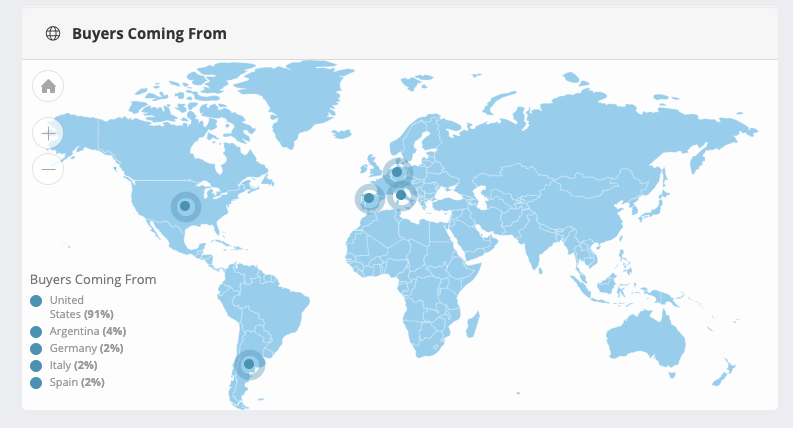
Please note that because of Surfside’s location and close proximity to the beach, we are not just seeing buyers from the U.S. but also from Argentina, Germany, Italy and Spain, with 55.7% of transactions being cash. It’s interesting to note that 50.5% of all owners are not primary residents and use their properties either as a second home, a vacation home or an investment. This is key when marketing your home for sale – micro data is what maximizes the value of your home and that’s what we specialize in.
To get a copy of our in-depth 3D-analyzer report for Surfside, please CLICK HERE!
It’s all about Data and the right analysis to understand how the market is behaving. Contact us for a no-obligation consultation and we’ll let you know if it’s the right time to sell according to your specific situation.
