Surfside Real Estate – May 2022 – monthly market report
How is the Surfside Real Estate Market Doing?
There are currently 20 Surfside homes for sale, compared to 7 in May of 2021:
- Highest priced listing is $17,500,000 for the modern, 2009 home at 1236 Biscaya Dr with 6 bedrooms / 8 bathrooms, 7,675 Sq.Ft. on 15,000 Sq.Ft. lot with 75′ of water frontage ($2,280/Sq.Ft.)
- Lowest priced listing is $1,200,000 for tear down at 8835 Froude Ave – 3/2 home with 1,656 Sq.Ft. on 5,600 Sq.Ft. lot being sold at land value
- Pending Sales: 9 (homes with a sales contract that have not yet closed)
- Closed Sales in May: 3 (compared to 6 closings in May of 2021)
- Median Sales Price in May: $1,500,000 (compared to $885,000 in May of 2021)
What is the average price per square foot in Surfside?
The average sold price per square foot in Surfside in April for homes not on the water was $745, compared to $518 in May of 2021.
- April’s average $920
- March’s average $977
- February’s average $699
- January’s average $574
- 2021’s average of $502
- 2020’s average of $416
There average sold price per square foot in Surfside in May for waterfront homes $3,639 with only one sale, compared to sales in May of 2021 and previous months as follows:
- April’s average – no sales
- March’s average – no sales
- February’s average $1,981 (one sale)
- January’s average $967 (only one sale)
Surfside Real Estate Micro-Stats
Feel free to download our complete market report for the last 12 months, showing micro-stats for Real Estate Surfside.

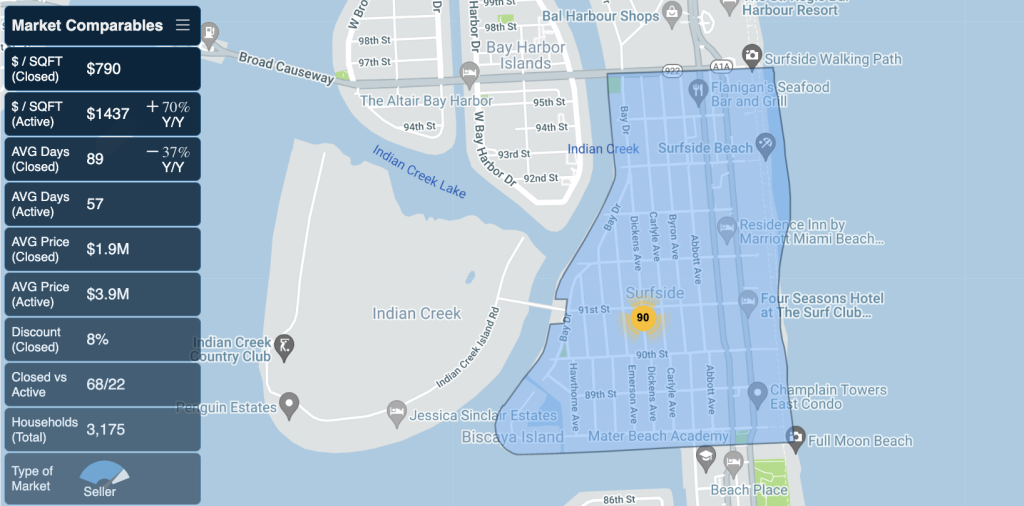
- Seller’s market with 4 months of inventory
- Most sold price ranges are between $700-900k and between $1-1.5 Million
- 60% of all purchases with CASH (no loan contingencies)
- 70.6% of all buyers bought as primary residence (to occupy the home)
DOWNLOAD SURFSIDE 3D MARKET REPORT
